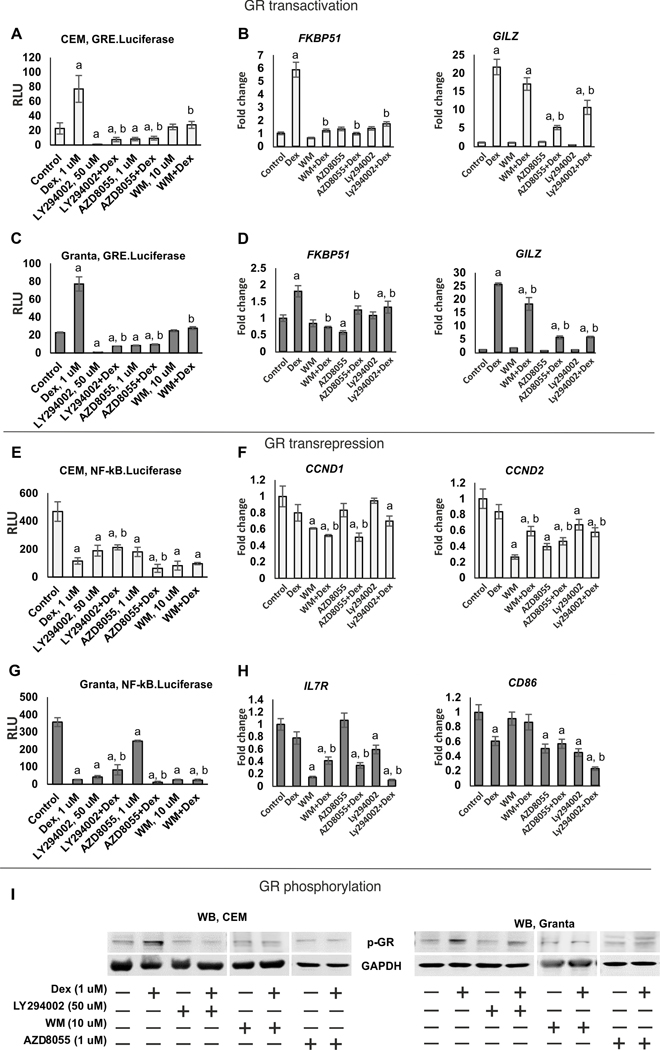
Figure 2. PI3K/mTOR/Akt inhibitors shift GR function towards transrepression.
CEM (A, E) and Granta (C, G) cells stably expressing GRE.Luciferase and NF-κB.Luciferase were pretreated with LY294002 (50 uM), AZD8055 (1 uM) and WM (10 uM) for 6 h and treated with either solvent or glucocorticoid Dex (1 uM) for 24 h. (A, C, E, G) Luciferase assay. Luciferase activity is presented as mean +/− SD for three individual wells/point. (B, D, F, H) Q-PCR analysis of the expression of GR- and NF-kB regulated endogenous genes. Q-PCR results for repressed genes (CCND1, CCND2, IL7R, CD86) and activated genes (FKBP51, GILZ) were normalized to the expression of housekeeping gene RPL27, and presented as fold change compared to control. Cells were treated as above. The mean +/− SD was calculated for three individual RNA samples/condition. Statistically significant differences as compared to: a-control; b-Dex (p<0.001) as and where indicated. (I) Western blot analysis of GR phosphorylation. Cells were treated as above. GAPDH was used as loading control.

