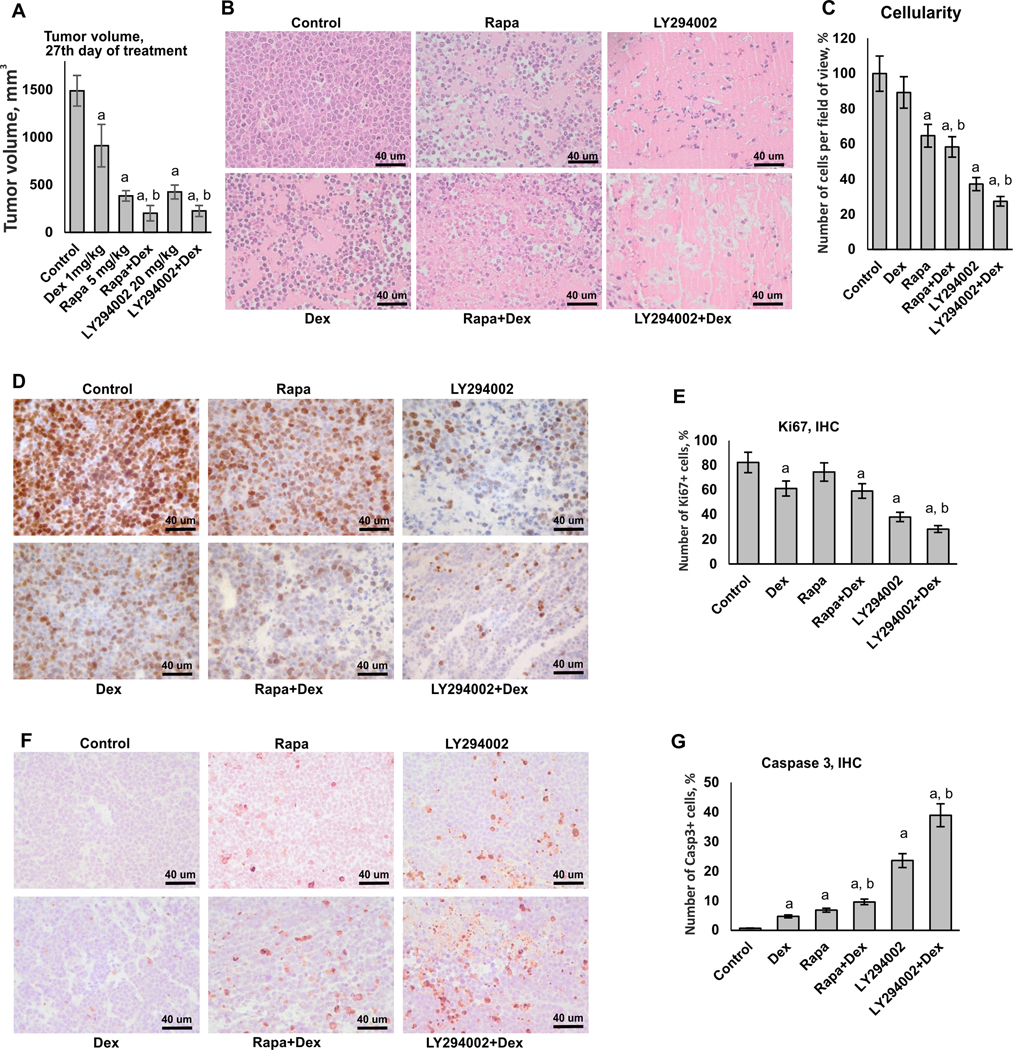
Figure 4. Cooperative anti-cancer effects of PI3K/mTOR/Akt inhibitors and Dexamethasone in lymphoma xenograft model.
Subcutaneous xenografts were established using Granta cells. Mice (10 animals/group) were treated every 48 h with i.p. injections of LY294002 (20 mg/kg), Rapa (5 mg/kg) or vehicle (30% PEG3350, 4% DMSO, 5% Tween-20 in PBS) followed by i.p. injections of Dex (1 mg/kg) of vehicle (5% DMSO in PBS) 6 h later. Control mice were monitored until the tumor size reached 1500 mm3 at which point they were euthanized. (A) Tumor volume on the 27th day of treatment. (B) H&E staining. (C) Quantification of cellularity in xenografts. (D, F) Immunohistochemical staining of xenograft samples for Ki67 (D), and caspase 3 (F). Scale bars: 40 um. (E, G) Quantification of Ki67- (E) and caspase 3- (G) positive cells. At least five individual fields per slide of each individual sample/treatment (at least 50 images/treatment group) were analyzed using Axioplan2 microscope software (Carl Zeiss). The cell density of xenografts and the number of Ki67- and caspase 3-positive cells in treated animals is presented as % to control. In A, C, E and G bar graphs the mean +/− SD is presented. Statistically significant differences as compared to: a-control; b-Dex (p<0.001) as and where indicated.

