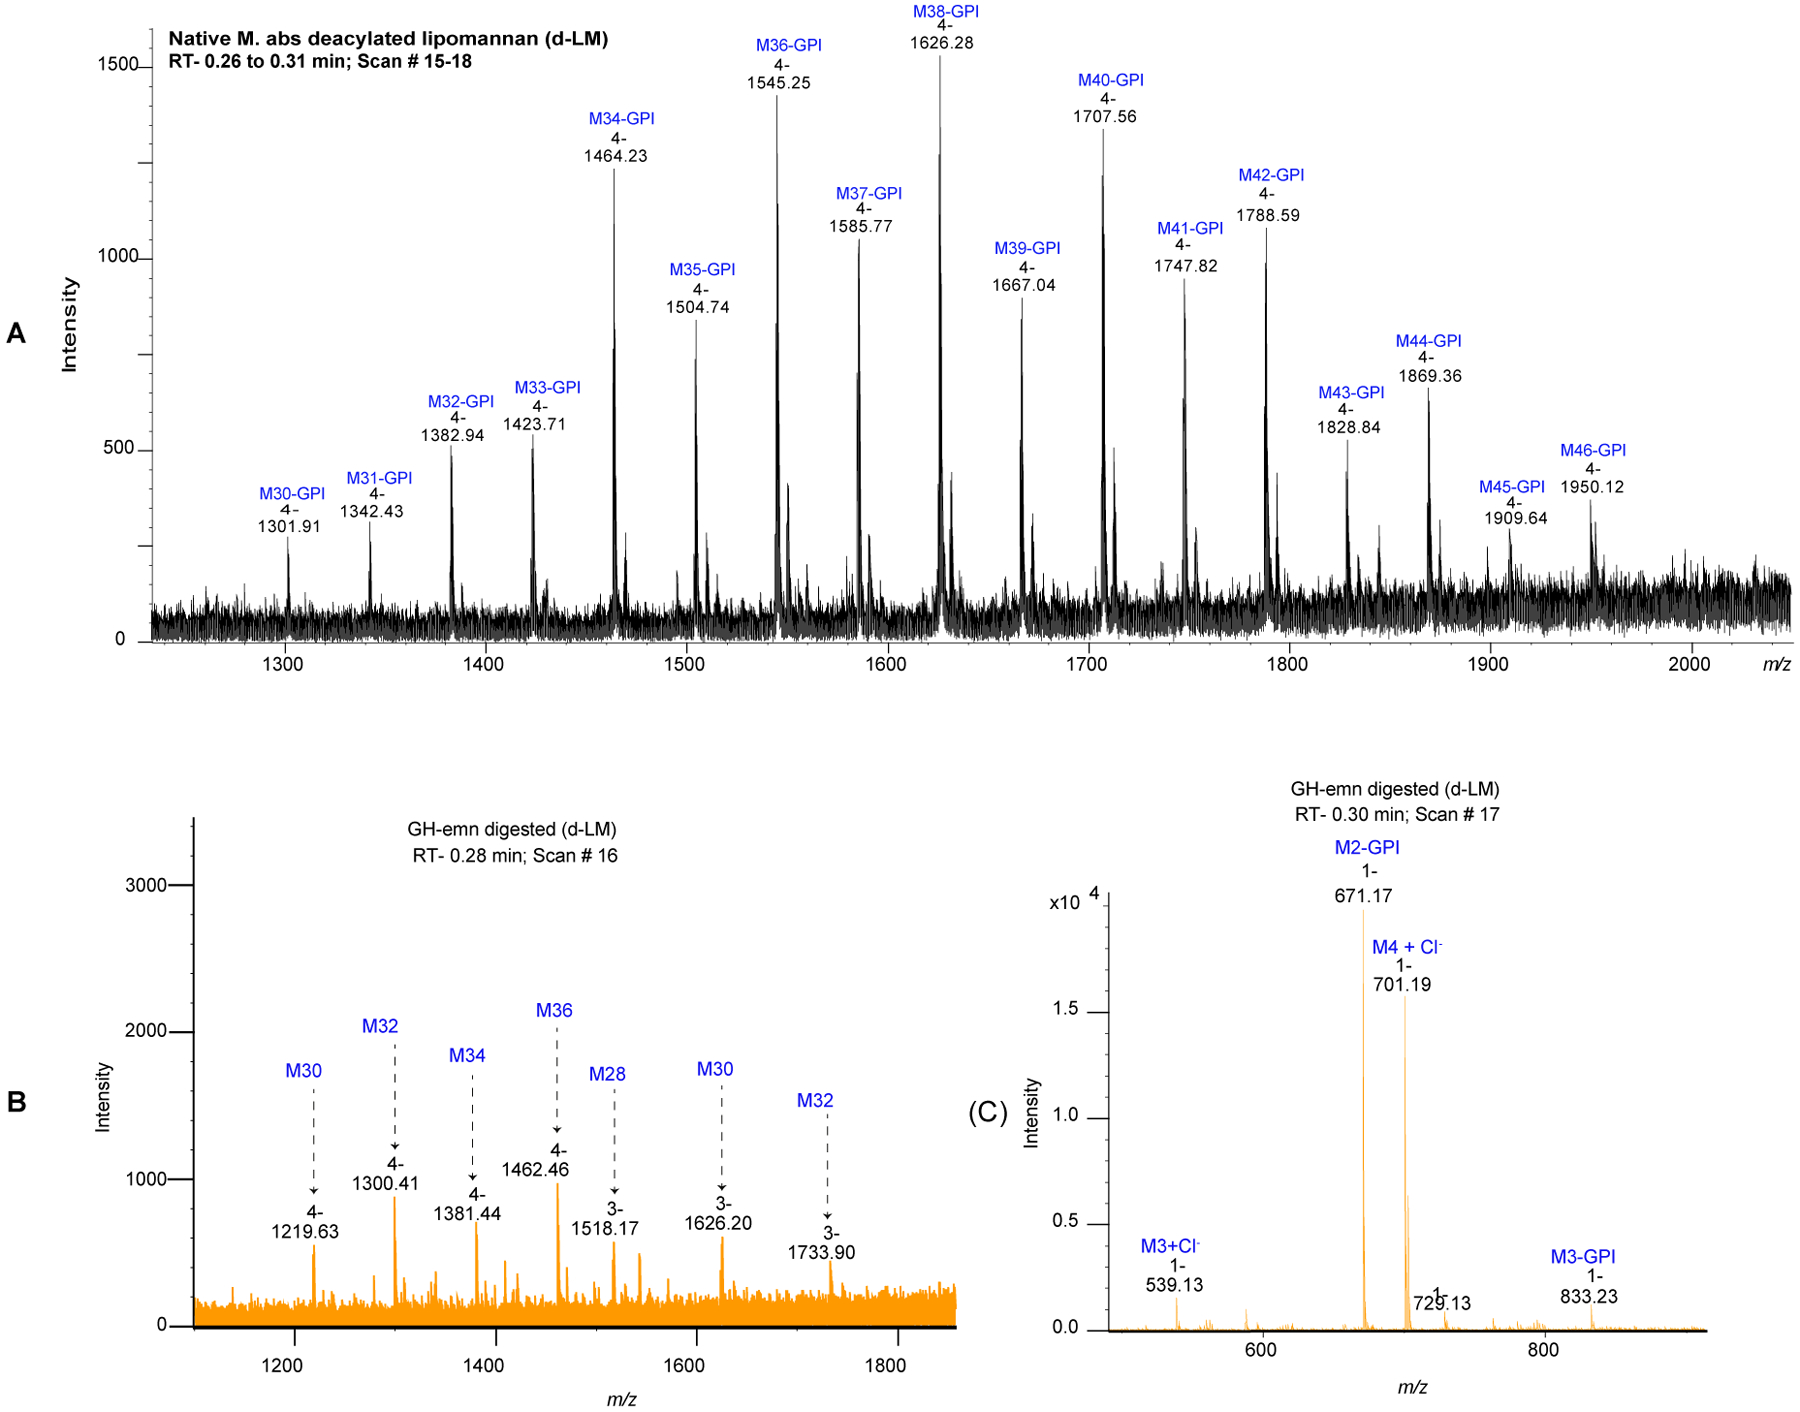
Figure 3: Negative ion liquid chromatography-mass spectrometry (LC-MS) analysis of the Mabs deacylated LM (d-LM) before and after digestion with α−1,6-endomannanase (GH-emn).

(A) LC-MS profile of Mabs d-LM before enzymatic treatment. The mass spectrum is dominated by a series of quadruply-charged ions corresponding to the high molecular weight mannan backbone containing 30 to 46 mannosyl residues [M30 to M46] (range of 5,000 to 7,800 Da). (B-C) LC-MS profile of Mabs d-LM after treatment with the GH-emn α−1,6-endomannanase. The mass spectrum at 0.28 min retention time (B) corresponds to oligomannans (lacking the glycerol-phosphatidyl inositol anchor [GPI]) with an even number of mannosyl residues from M28 to M36. The mass spectrum at 0.30 min retention time (C) shows two major ions corresponding to the mass of methylated species of d-PIM2 (m/z 671.17 [M-H]), and a tetra-mannoside (M4) lacking the GPI anchor (m/z 701.19 [M+Cl]−).
