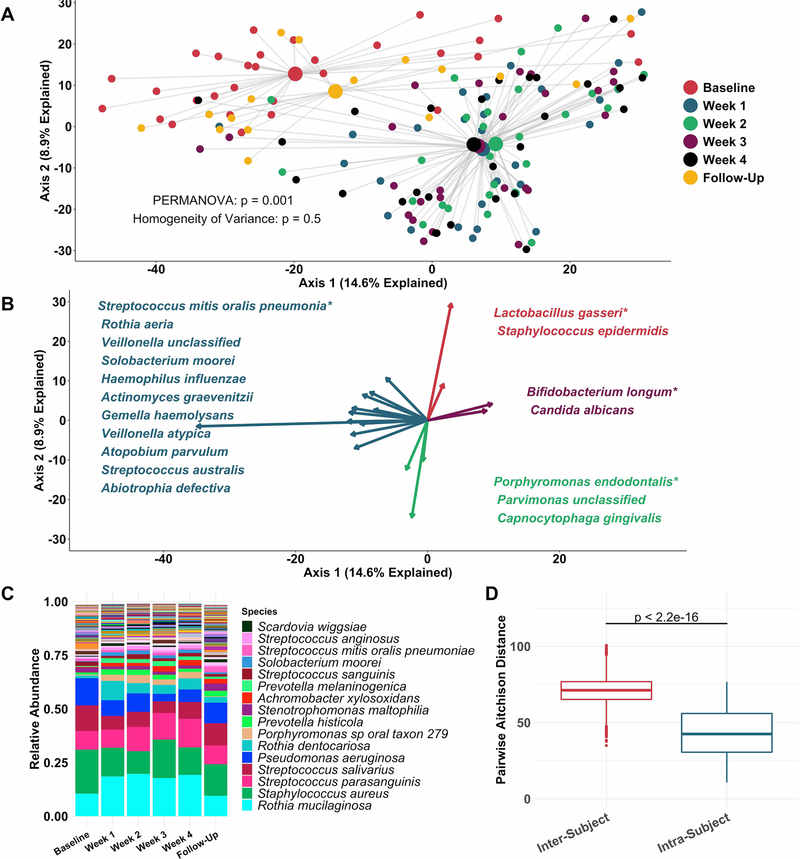
Figure 2.
Sputum microbiota shifts after 1 week of inhaled tobramycin. Taxonomic profiles of all samples were calculated via metagenomic shotgun sequencing followed by metagenomic phylogenetic analysis. (A) Principal components analysis using the Aitchison dissimilarity metric–pairwise Euclidean distance between samples after a centred log-transformation of relative abundance data, which is optimised for sparse, compositional data such as microbiota61,62–of all samples (small dots) coloured and grouped by week on therapy. Large dots represent the centroid of each group, with lines connecting individual sample dots to their respective centroids. PERMANOVA tested for difference between centroids, Homogeneity of Variance assessed whether dispersion in data within each timepoint (distance of each datapoint from the respective centroid) differed among groups. (B) Biplot demonstrating the 18 taxa most responsible for the taxonomic difference between samples in (A). Length of vectors indicates the extent to which taxa contribute to intersample dissimilarity; starred taxa are those with longest vectors in each colour grouping. (C) Average taxonomic profiles of all samples by week on therapy at the species level. Only the top 14 most abundant species names are shown for ease of display. (D) Comparison of intrasubject versus intersubject microbiota dissimilarity at the species level by Aitchison dissimilarity, which takes into account both abundances and presence of individual taxa. Baseline samples were collected prior to starting therapy, weeks 1–4 represent weekly samples collected while individuals were on therapy and follow-up samples were collected 1 month after cessation of therapy. Wilcoxon signed-rank test was used to assess difference between groups. Taxonomic profiles of all samples individually are presented in online supplementary figures S4 and S5. Boxes represent interquartile region and middle represents the median. Streptococcus mitis, Streptococcus oralis and Streptococcus pneumoniae cannot be reliably differentiated by MetaPhlAn2 and are grouped in this analysis.

