Figure 3.
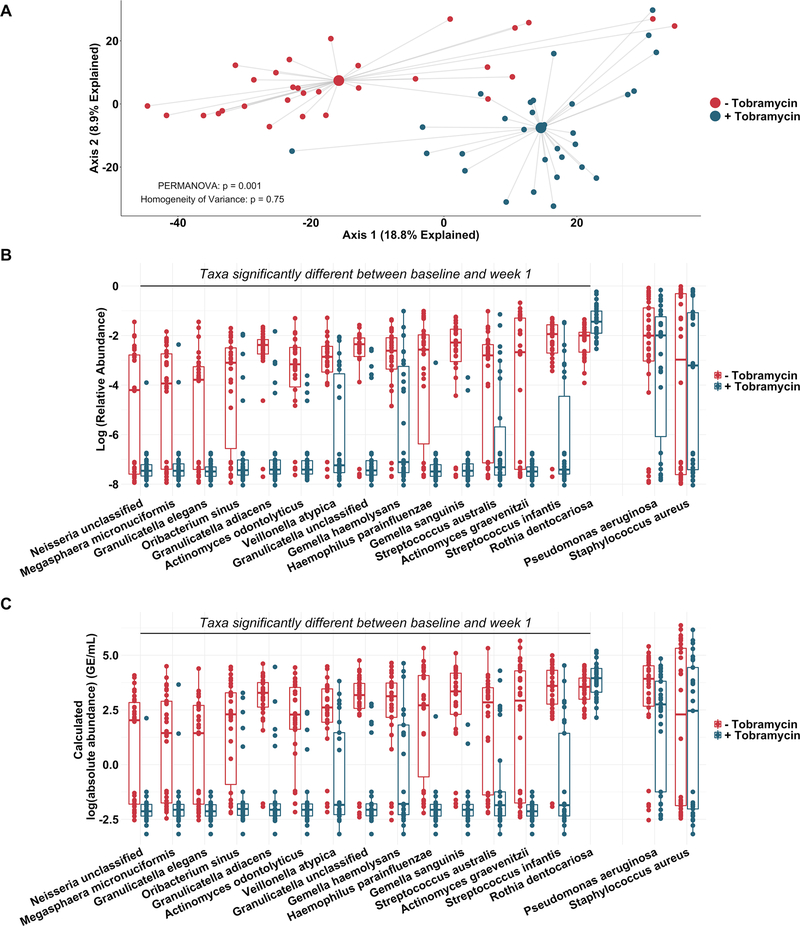
Non-dominant taxa contribute substantially to taxonomic shift with therapy. Taxonomic profiles of all samples defined by metagenomic sequencing and phylogenetic analysis. (A) Principal component analysis using the Aitchison dissimilarity metric of all baseline and week 1 samples (small dots) coloured and grouped by antibiotic treatment status. Large dots represent the centroid of each treatment category, with lines connecting individual sample dots to their respective centroids. (B) Log-relative abundances and (C) calculated log-absolute abundances of the 15 taxa that contributed most to the differences between baseline and week 1 samples identified in (A) as well as Pseudomonas aeruginosa and Staphylococcus aureus for comparison. PERMANOVA is a statistical test for difference between centroids, Homogeneity of Variance is a statistical test which assessed the difference in spread between two groups. Absolute abundances were calculated by multiplying relative abundances via MetaPhlAn2 by total bacterial loads as determined via universal 16S qPCR. Boxes represent interquartile regions and middle lines represent the medians. qPCR, quantitative PCR.

