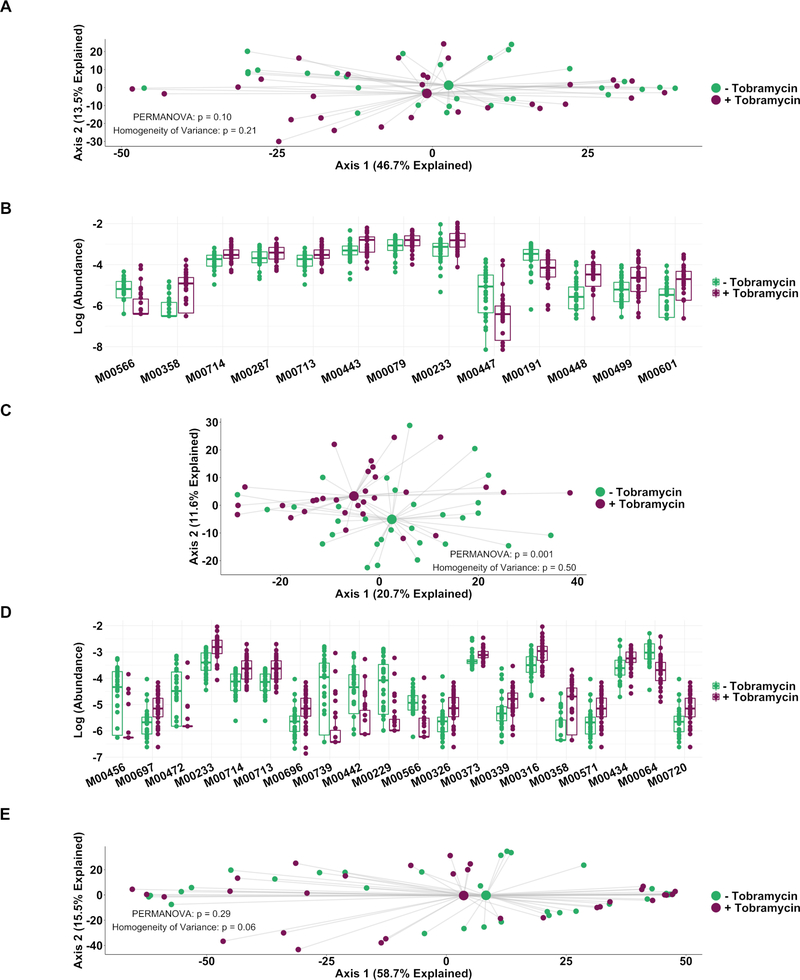
Figure 5.
Genetically conferred functional capacity changes relatively little with antibiotic therapy. Genetically conferred functional capacity was determined by mapping all shotgun sequencing reads to the KEGG database at the module level. (A) Principal component analysis using the Aitchison dissimilarity metric–Euclidean distance between samples after a centred log-transformation of relative abundance data–of baseline and week 1 samples without removal of dominant taxa (small dots) coloured and grouped by antibiotic status. (B) Log-abundances of all significantly different modules between baseline and week 1 samples without dominant taxa removed. (C) Principal component analysis using the Aitchison dissimilarity metric of all baseline and week 1 samples coloured and grouped by antibiotic treatment status after removal of reads from dominant taxa. (D) Log-abundances of the 20 modules with the largest effect size of those significantly different modules between baseline and week 1 samples after removal of reads from dominant taxa. PERMANOVA is a statistical test for difference between centroids, Homogeneity of Variance is a statistical test which assesses the difference. Modules are listed in table 1. (E) Principal component analysis using the Aitchison dissimilarity metric of all baseline and week 1 samples (small dots) coloured and grouped by antibiotic treatment status using only reads from dominant taxa. Large dots represent the centroid of each group, with lines connecting individual sample dots to their respective centroids. Boxes represent interquartile region and middle represents the median.

