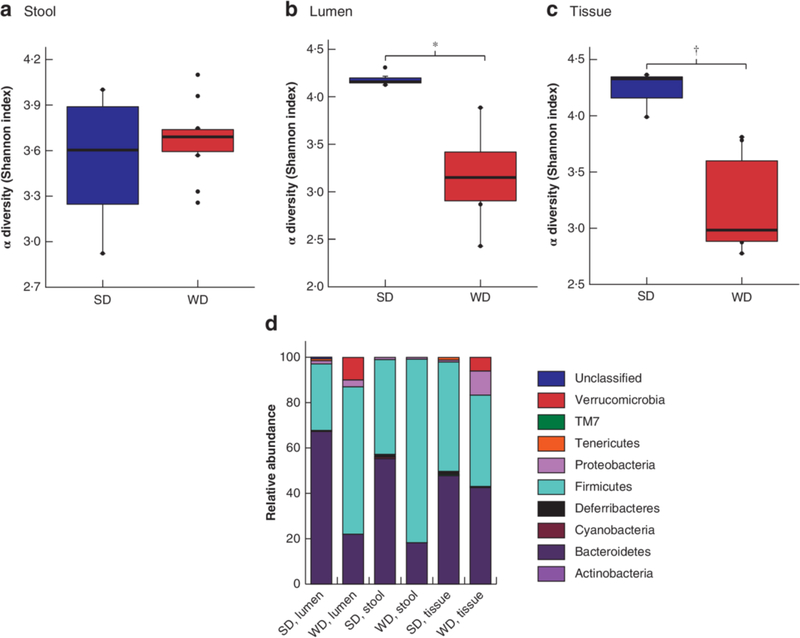
Fig.3. 16S ribosomal RNA analysis of colonic microbiota in preoperative samples.
a–c Comparison of α diversity, based on Shannon index, in standard chow (SD)- and Western (WD)-fed mice before surgery and antibiotic exposure in expelled stool (a), colonic lumen (b) and colonic tissue (c). Mean values (bold lines), i.q.r. (boxes), and range (error bars) excluding outliers (dots) are shown. *P = 0.034, †P = 0.005 (permutational ANOVA). d Relative abundance plots at the level of phyla.

