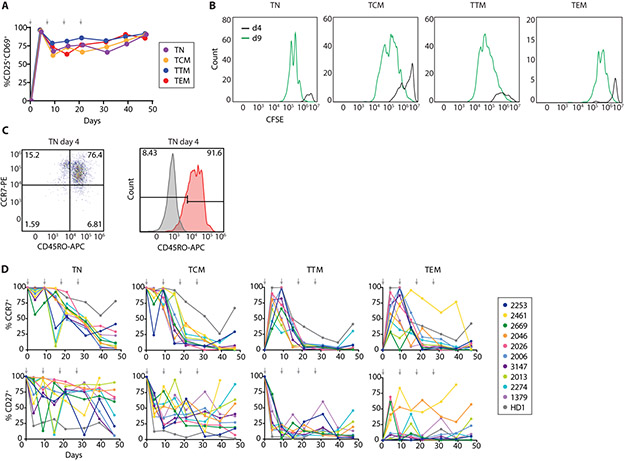
Fig. 3. Changes in activation state, proliferative status, and phenotypic marker expression following repeated activation of CD4+ T-cell subsets.
(A) Activation status of CD4+ T-cells throughout the MSVOA averaged across 4 representative individuals as percent of cells expressing CD25 and/or CD69. (B) CFSE dilution after first stimulation. Cells from each subset were stained with CFSE and activated on day 0, then analyzed by flow cytometry at days 4 and 9. (C) CD45RO expression on TN from representative individual. 91.6% of TN became CD45RO+ by day 4 after initial stimulation (Fig. S1A). (D) Percent of cells from each subset culture expressing CCR7 and CD27 at the indicated timepoints. Arrows denote stimulation timepoints.

