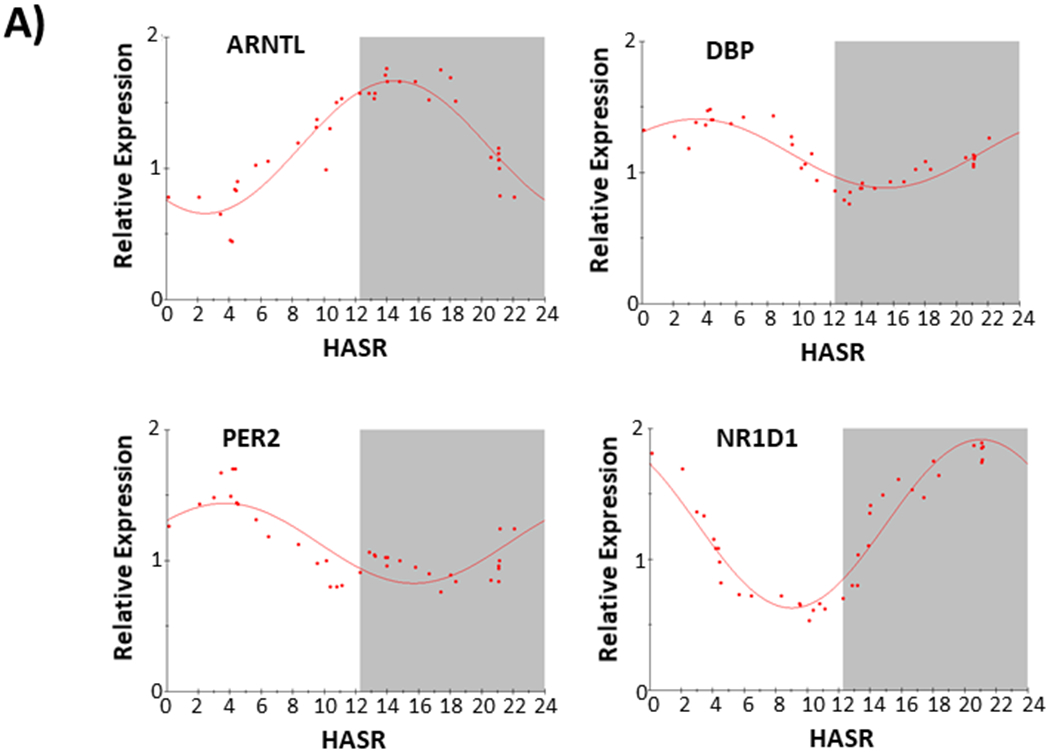
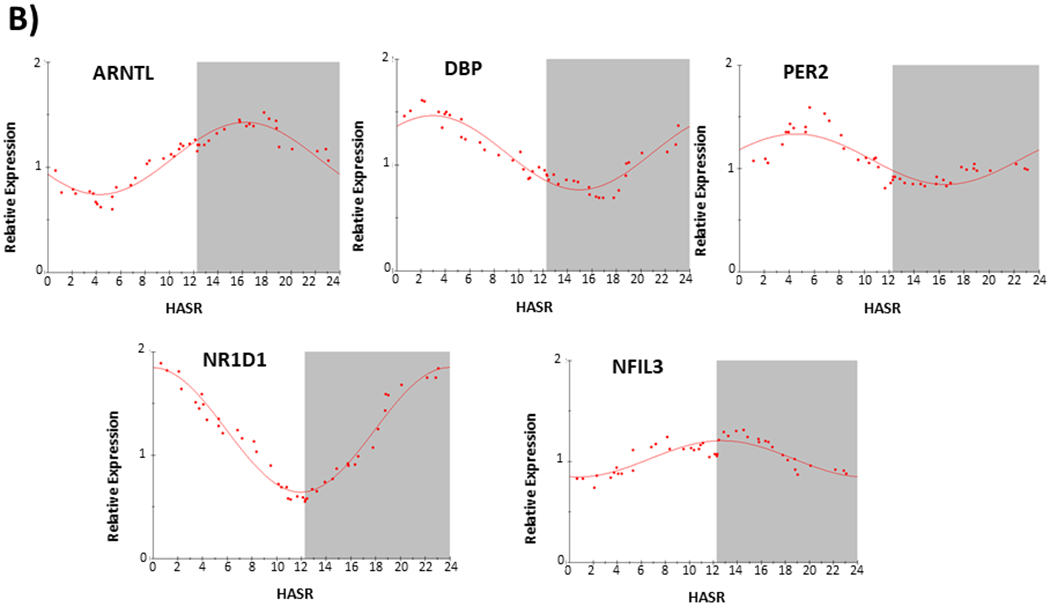
Figure 2.


Circadian expression of core circadian clock gene (ARNTL, DBP, NFIL3, NR1D1, and PER2) transcripts in failing human hearts. A) Data from F set 1, n=37. B) Data from F set 2, n=45. HASR; hours after sunrise. Gene transcript in upper left corner of each plot. Each data point (organized according to collection time in HASR) is calculated from (A, F set 1) the mean of 9 consecutive samples, with 37 datapoints calculated from 37 samples, or (B, F set 2) the mean of 11 consecutive samples, with 45 datapoints calculated from 45 samples. The best fit from partial Fourier-analysis (calculated using Chronosfit 1.06) is represented by the solid line. Approximate light/dark interval (based upon approximate yearly average length of night in Pittsburgh PA) is represented with dark-phase in gray.
