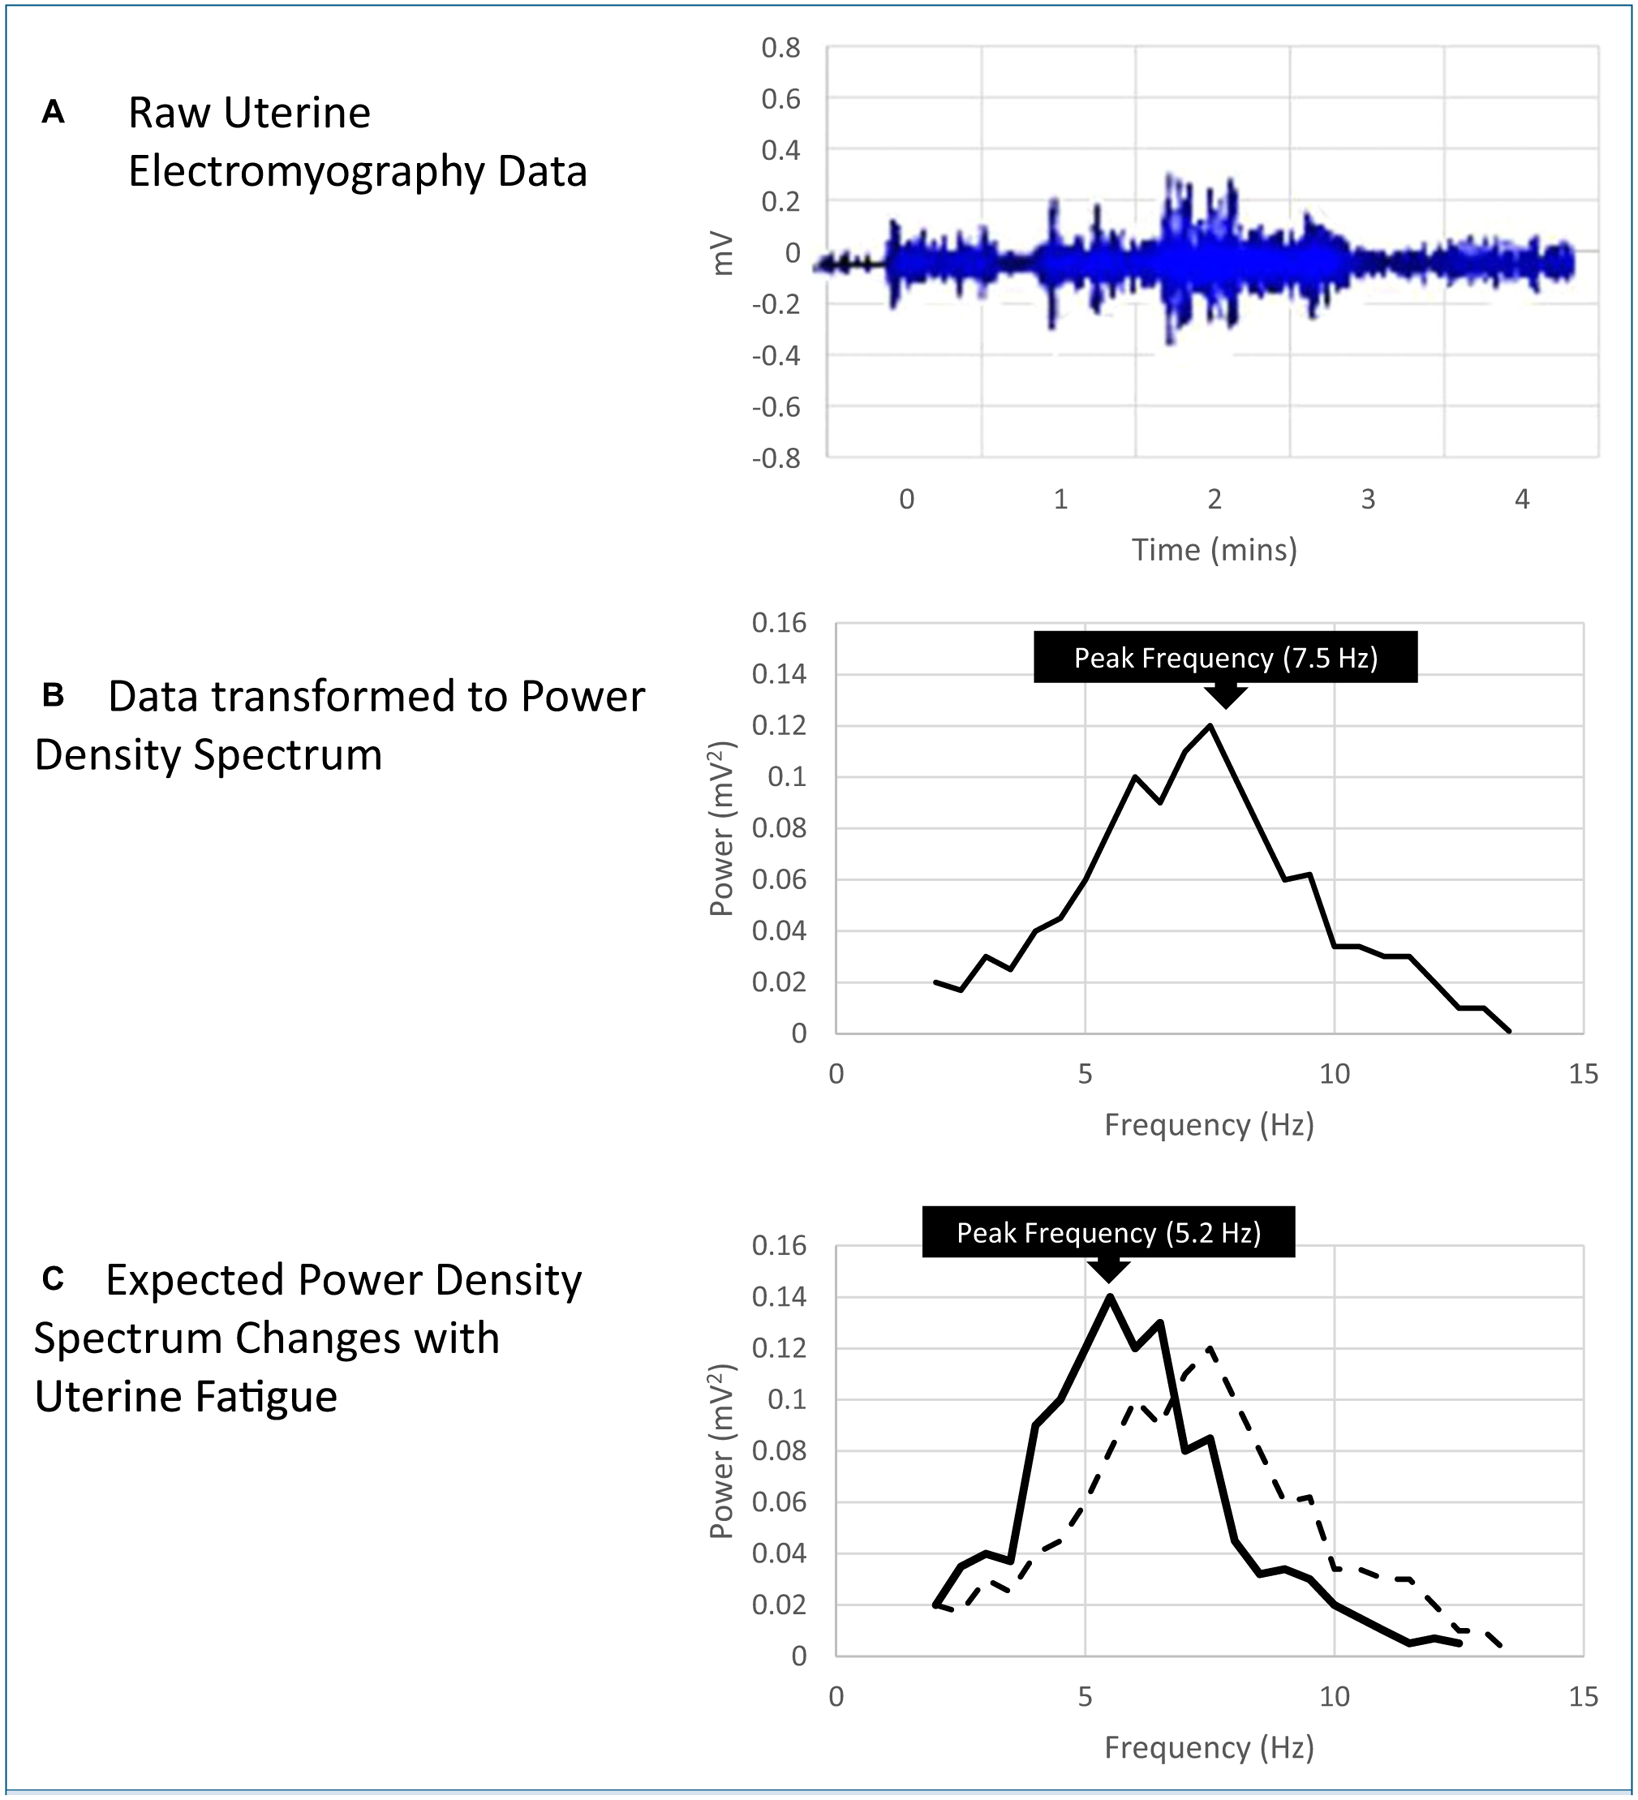
Figure 2. Electromyography Power Density Spectrum.

A) Raw electromyography (EMG) data for a single uterine contraction (electrical potential over time).
B) Raw EMG transformed using Fast Fourier Transform to power density spectrum for a single uterine contraction (power over frequency).
C) With uterine fatigue, the median and mean frequency of the power density spectrum is expected to decrease (left shift, x-axis) while the amplitude of the peak frequency is expected to increase (y-axis). Increased amplitude of the peak frequency (y-axis) is also associated with cesarean birth, labor dystocia, and labor augmentation. (solid line = fatigue; dotted line = normal contraction).
