
FIGURE 1.
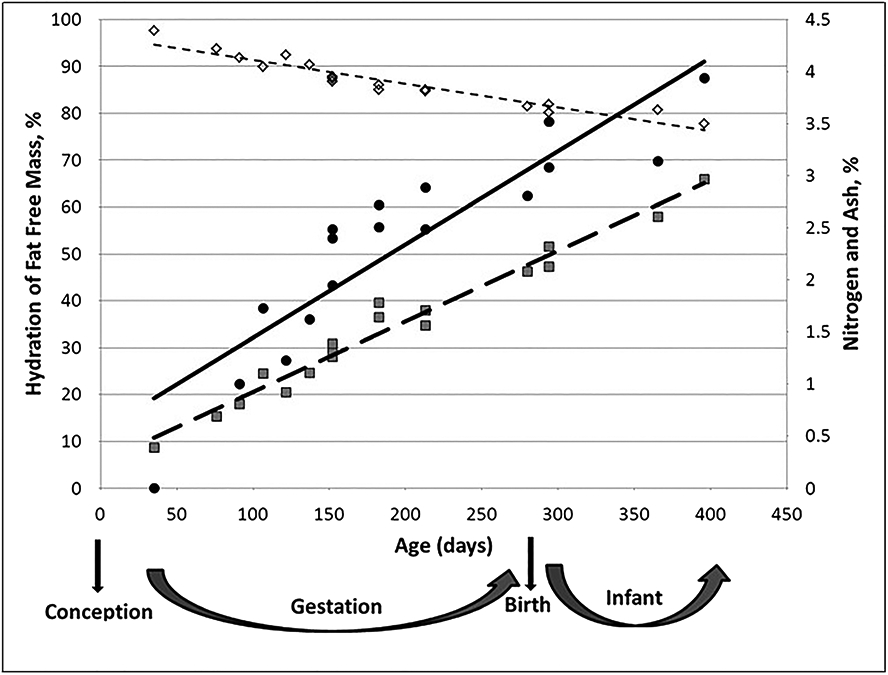
Effect of age on fat-free mass composition. Adapted from Moulton1 as published in Toro-Ramos et al,2 with permission. ◊ (–––), hydration of fat-free mass (%) = −0.05 × age (days) + 96.31, R2 = 0.91 ( standard error estimate (SEE) = 1.63%); (–), ash (%) = 0.009 × age (days) + 0.55, R2 = 0.81 (SEE = 0.443%); (–—), nitrogen (%) = 0.007 × age (days) + 0.25, R2 = 0.97 (SEE = 1.123%)