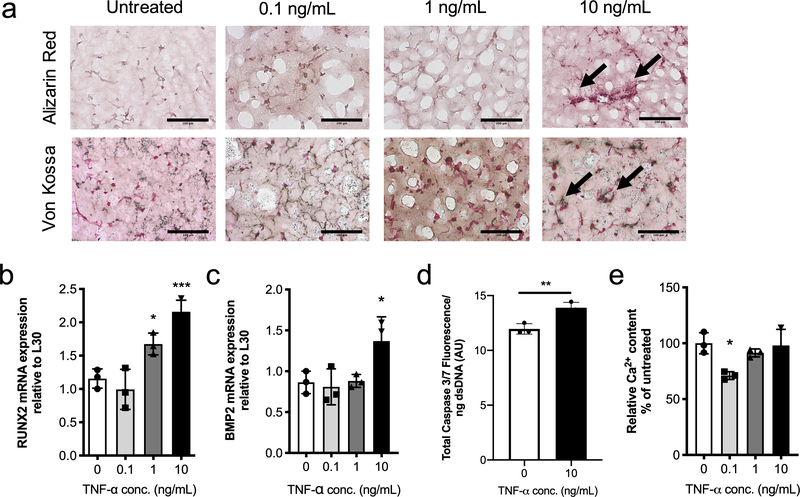
Figure 3. TNF-α treatment promotes the VIC osteoblast-like phenotype and matrix calcification.
a) Representative images from 3D cryosectioned samples stained with Alizarin Red (top) and Von Kossa (bottom) for untreated conditions and 0.1, 1, and 10 ng/mL TNF-α. Increasing TNF-α treatment leads to an increase in Alizarin Red (red) and Von Kossa (black) staining. Scale bars=100μm. b,c) mRNA gene expression levels relative to L30 for calcific markers b) RUNX2 and c) BMP2. Both RUNX2 and BMP2 gene expression were significantly upregulated relative to untreated with 10 ng/mL of TNF-α. d) Quantification of Caspase 3 fluorescence signal normalized with dsDNA content. Caspase 3 fluorescence shows a significantly increased in VICs treated with TNF-α compared to untreated samples. e) Deposited calcium signal normalized to dsDNA content and expressed as percent of untreated control (0 ng/mL of TNF-α). No trends were observed with TNF-α treatment, although significantly reduced calcium content was observed with 0.1 ng/mL of TNF-α. ***=p<0.001, **=p<0.01 and **=p<0.05 based on one-way ANOVA and t-test.

