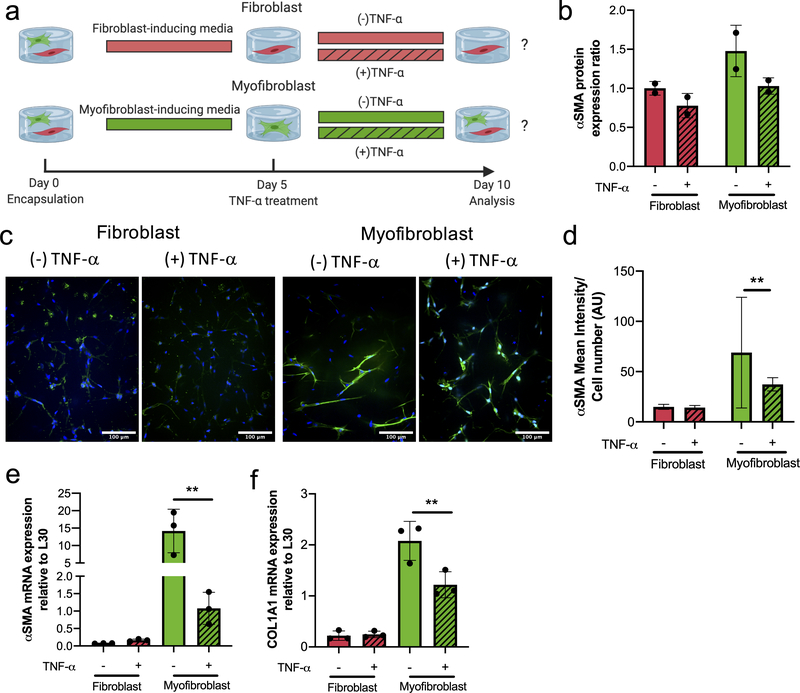
Figure 4. VIC myofibroblast populations respond to TNF-α treatment by decreasing their fibrotic markers.
a) Experimental design to investigate the effects of TNF-α (10 ng/mL) treatment on defined VIC fibroblast or activated myofibroblast populations. b) αSMA protein expression ratio for fibroblast (red) and activated myofibroblast (green) phenotypes in the presence or absence of TNF-α. αSMA protein expression decreases with the addition of TNF-α (patterned) on both fibroblasts and activated myofibroblast. c) Representative immunostaining images for αSMA stress fibers of fibroblasts and activated myofibroblast in the presence or absence of TNF-α. Nucleus (blue) and αSMA (green). Scale bars=100μm. d) Intensity analysis of αSMA normalized to cell number results in a significant decrease in αSMA mean intensity for activated myofibroblast treated with 10 ng/mL of TNF-α. No change in intensity was observed in VIC fibroblasts treated with 10 ng/mL of TNF-α. e) αSMA and f) COL1A1 mRNA gene expression levels relative to L30. Fibroblast populations treated with 10 ng/mL TNF-α had no significant changes in gene expression of αSMA and COL1A1 relative to untreated fibroblasts. Activated myofibroblast populations treated with TNF-α resulted in a significant downregulation of αSMA and COL1A1 gene expression. **=p<0.01 based on t-test.

