
Fig. 5. Single-cell sequencing of mediastinal lymph nodes shows resolution of inflammatory response.
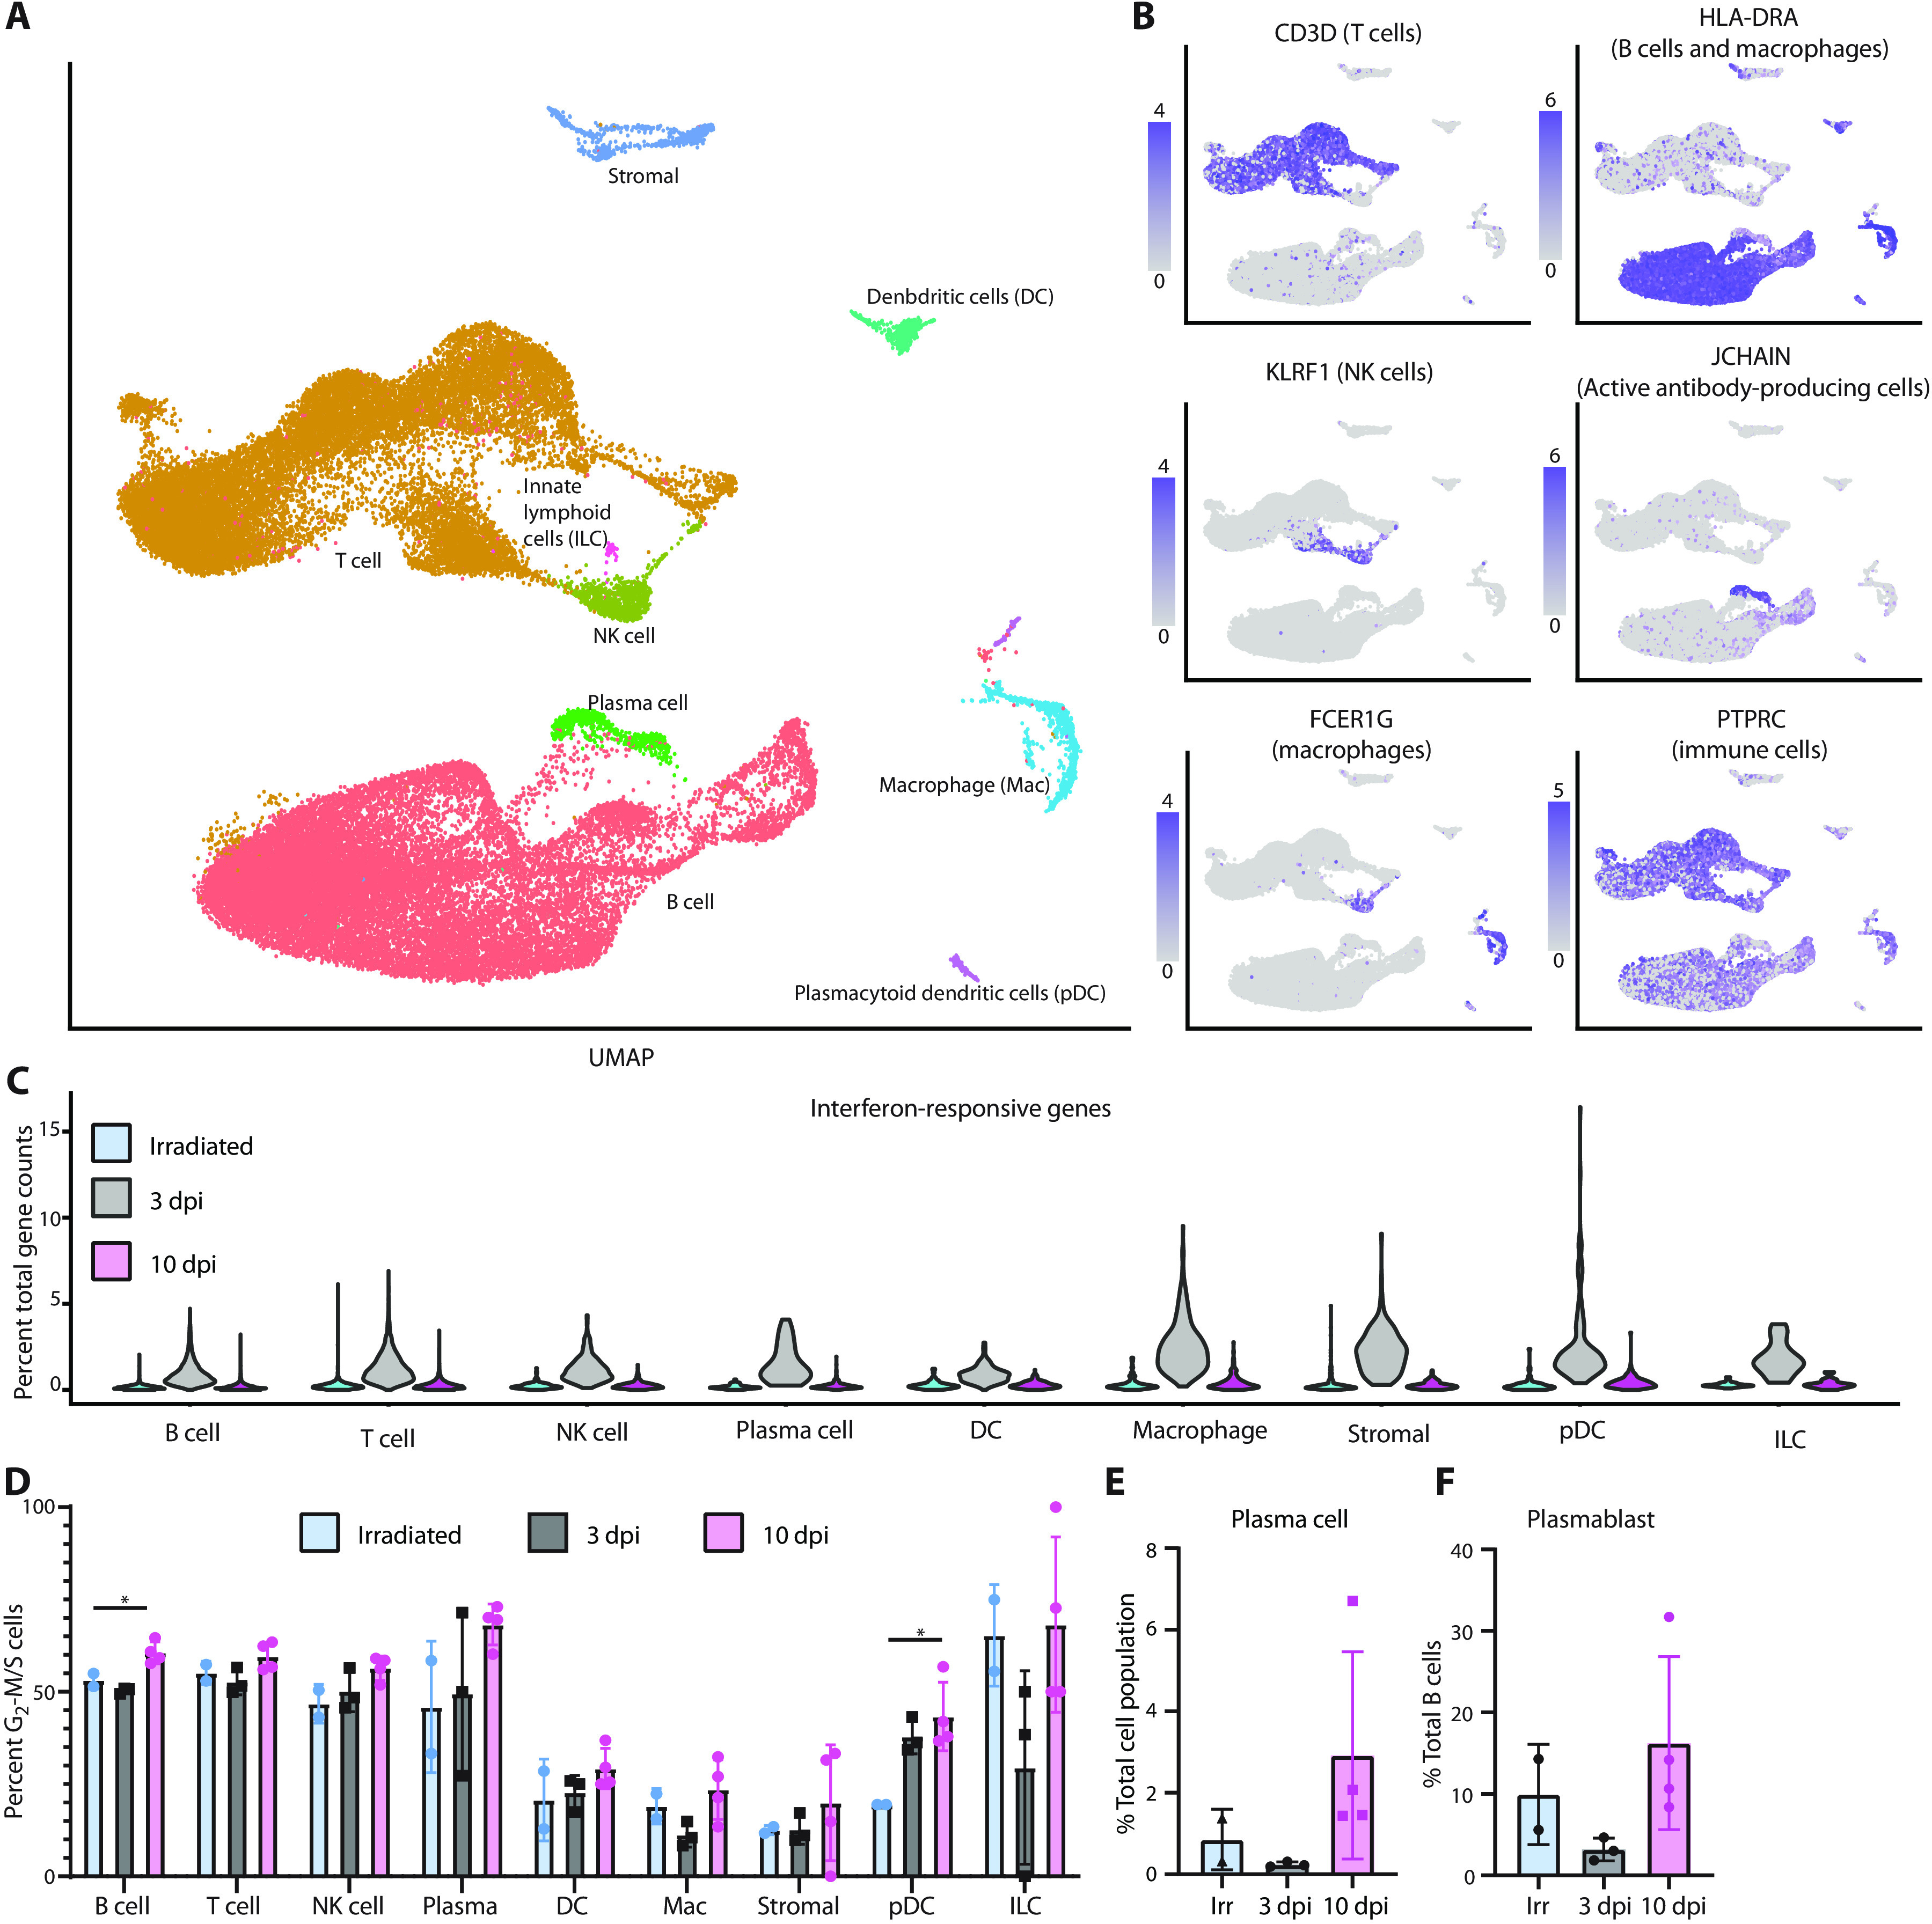
(A) UMAP projection of single-cell sequencing data from cells isolated from the mediastinal lymph nodes of all 10 animals combined. Each point represents an individual cell, and cells are colored on the basis of their cell type. The names of the cell types are placed next to their largest cluster. (B) Single gene expression analysis was used to validate cell type identifications. (C) Percent of total gene counts for each cell for a subset of interferon-responsive genes (y axis). The x axis denotes cell types and experimental group. (D) Percentage of each cell population (x axis) that is actively dividing (stage G2-M or S) as determined by a profile of gene expression. Each point is an individual animal, and bars represent the mean and SD of the samples. (E) The percentage of plasma cells in each sample compared relative to the total cell number is plotted. (F) The percentage of plasmablast cells relative to the number of B cells is plotted. *P < 0.05, one-way ANOVA.