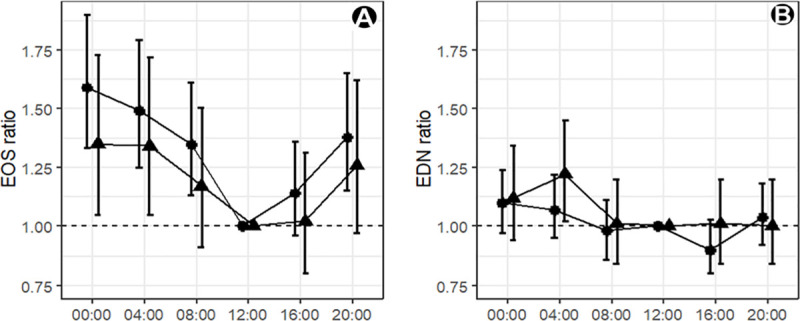
Fig 3. Temporal variation in eosinophil and eosinophil-derived neurotoxin levels.

An EOS or EDN ratio of 1.00 indicates there is no difference in mean between that timepoint and the mean level at 12:00h for (A) blood eosinophils (B) serum EDN for (▲) healthy (n = 10) and (●) mild/moderate asthma subjects (n = 20). Group means are shown with 95% CI.
