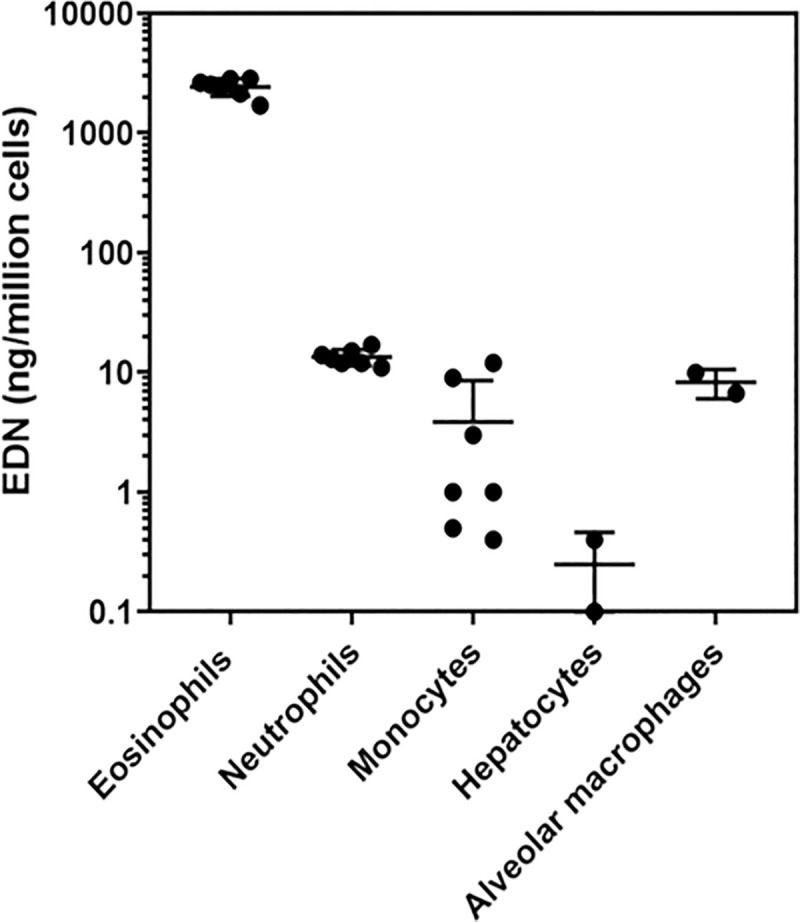
Fig 4. Scatter dot plot showing the comparison of eosinophil-derived neurotoxin levels in donor derived cells: Eosinophils, neutrophils, monocytes (n = 7) and hepatocytes and alveolar macrophages (n = 2).

Group means are shown with standard deviations.
