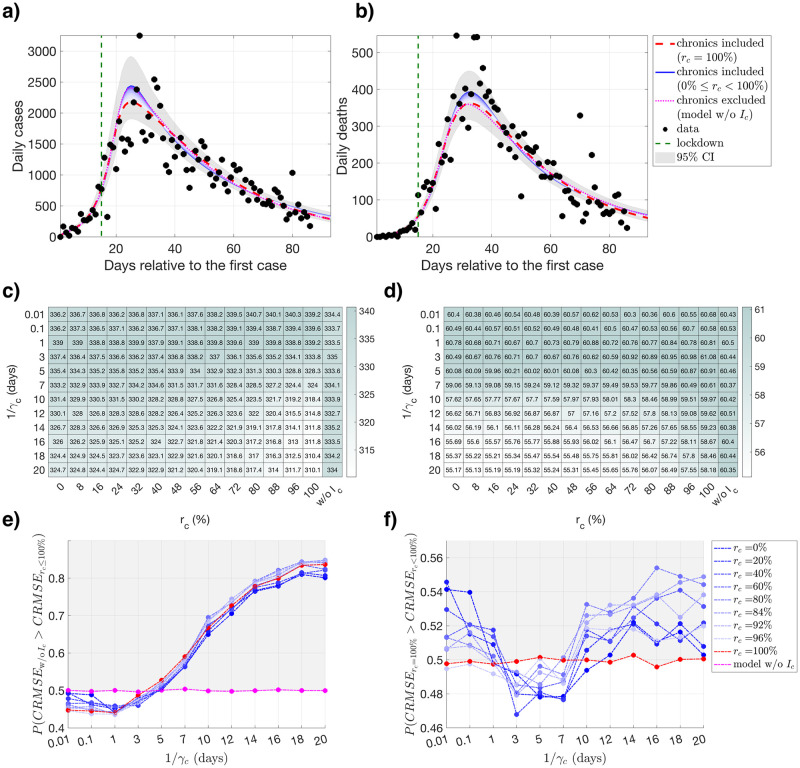
Fig 2. Fitting and Root Mean Squared Error (RMSE) results for Lombardy.
Fitting and RMSE results for Lombardy, calculated using different levels and durations of infectiousness for the chronically infected population. Model outcomes (presented for 1/γc = 14 days) for the number of a) daily confimed cases and b) daily deaths using the data until the introduction of relaxation for model fitting, respectively. Darker shades of blue represent the fitting results with increased infectiousness of the chronically infected population, i.e., lower rc values within the range 0 ≤ rc < 100%. Fitting results for rc = 100% are drawn in red, and the fitting results for the model without the Ic compartment (model w/o Ic) are drawn in pink. Data points that are used for fitting are drawn in black. Gray areas around the model outcomes represent the union of the 95% confidence intervals calculated for all models. RMSE values c) for the number of daily confirmed cases and d) the number of daily deaths for a given rc and γc value used for fitting, where model w/o Ic represents the results for the model without the Ic compartment. e) Probability of the model without the Ic compartment (model w/o Ic) having a greater combined RMSE (CRMSE) value than the model with the Ic compartment for all levels of reduced infectiousness (rc ≤ 100%) for different rc and γc values. f) Probability of the model where individuals are being diagnosed without being infectious (rc = 100%) having a greater combined RMSE (CRMSE) value than the model with individuals with a a prolonged infectiousness (rc < 100%) for different rc and γc values. Points in the gray areas represent the models that are providing a better fit more frequently than e) the model without the Ic compartment (model w/o Ic) and f) the model with rc = 100%.

