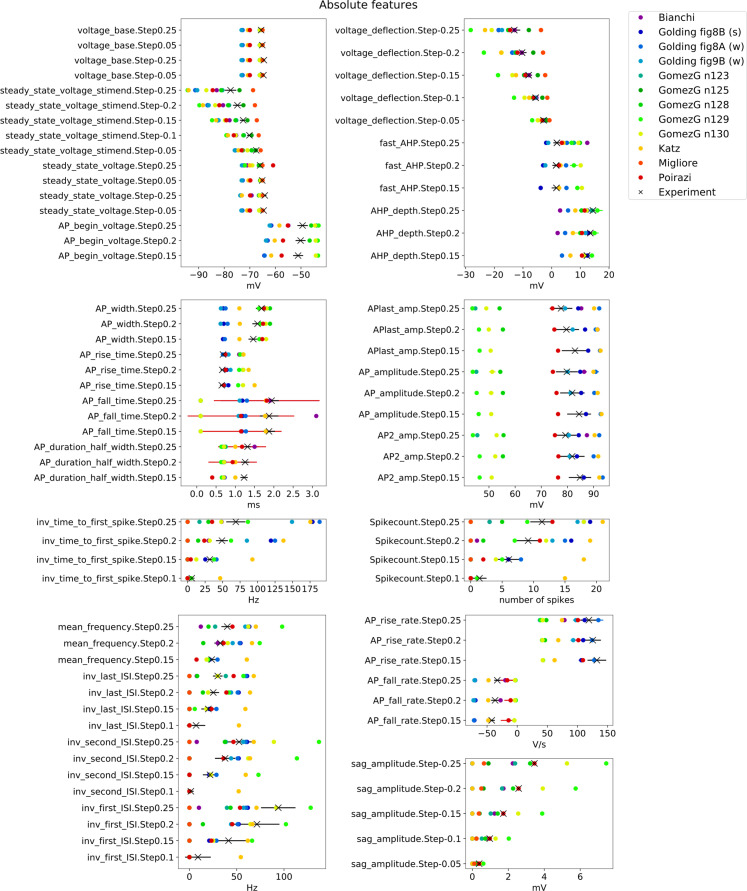
Fig 3. Feature values from the Somatic Features Test of HippoUnit applied to several published models.
Absolute feature values extracted (using the electrophys Feature Extraction Library (eFEL)) from the voltage responses of the models to somatic current injections of varying amplitude, compared to mean experimental values (black X) that were extracted from the patch clamp dataset. Black solid, horizontal lines indicate the experimental standard deviation. Colored solid, horizontal lines typically show the standard deviation of spiking features of models, where the feature value of each action potential in the voltage trace is extracted and averaged. Feature names (y axis labels) are indicated as they are used in eFEL combined with the step current injection amplitude. Not all the evaluated features are shown here. (The (s) and (w) notations of the Golding et al. 2001 models in the legend indicate the strong and weak propagating versions of the model).

