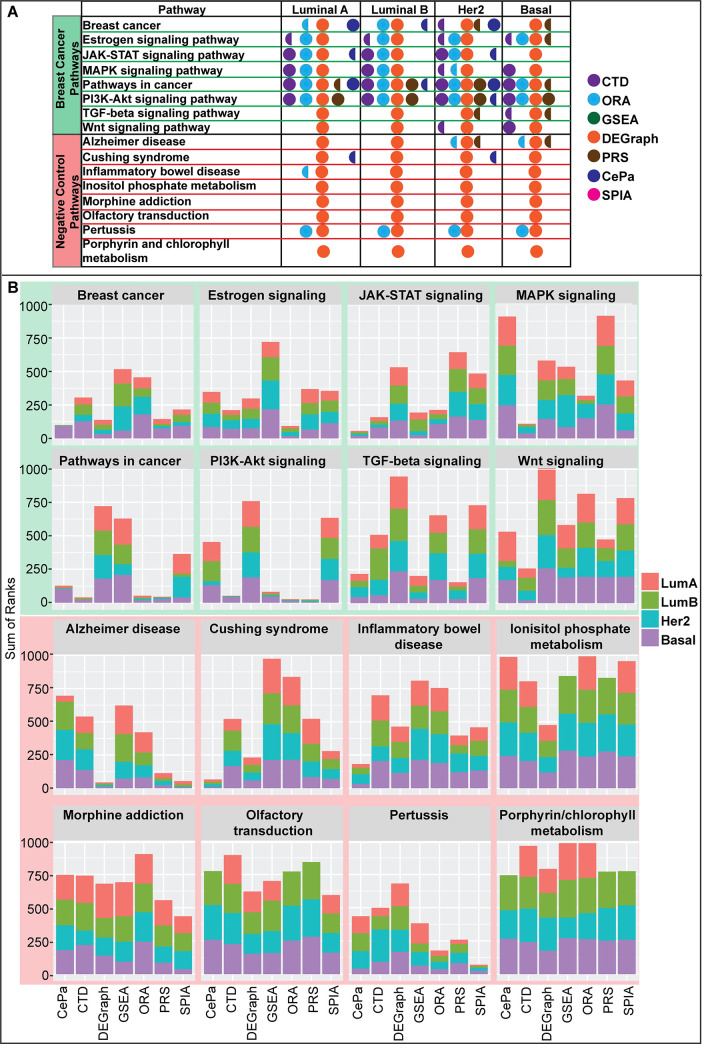
Fig 5. Sensitivity and specificity of pathway enrichment methods compared to CTD.
Pathway ranks outputted by 7 pathway enrichment methods (CTD, ORA, GSEA [27], DEGraph [30], CePa [28], PRS [33], SPIA [29]) associated with eight breast cancer-related (highlighted in green) and eight pathways unrelated to breast cancer (highlighted in red). (A) Full circles denote a given pathway enrichment method outputted an FDR p-value < 0.05 for a given pathway. Semi-circles denote borderline significance (0.05 < FDR < 0.15). DEGraph appears to be the most sensitive pathway enrichment analysis method, followed by CTD and ORA. However, DEGraph and ORA lack specificity compared to CTD, in that they also call several pathways unrelated to breast cancer significant. (B) Stacked barplots show the pathway ranks for 8 breast cancer relevant and 8 negative control biological pathways outputted by 7 different topological- or set-based pathway enrichment methods. The stacked barplots can be interpreted by looking at two different features: overall height and the differences in height of subtype rankings. Overall height indicates that a given pathway enrichment method ranked that pathway as less important compared to competing pathway enrichment methods. Differences in subtype height within a given method reveals whether or not subtype-specific differences were captured by that particular pathway enrichment method for that pathway. Plotting the pathway ranks of breast cancer relevant pathways across methods identifies DEGraph as a poorly specific enrichment method. In contrast, CTD shows both high specificity and sensitivity.

