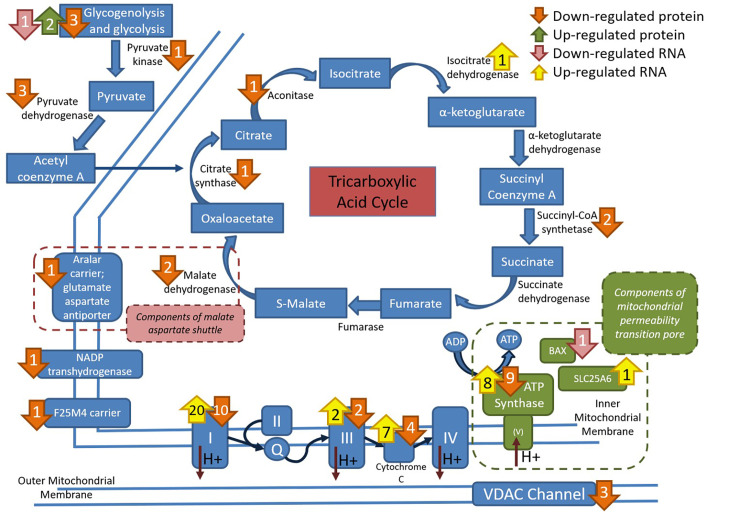
Fig 3. Depiction of the location of differentially expressed proteins and genes within the mitochondrial tricarboxylic acid cycle, electron transport system and mitochondrial Ca2+regulation.
Increased expression is in green for protein and yellow for genes. Decreased expression is in orange for proteins and pink for genes. Note the strong impact of RER-susceptibility on the electron transfer system and channels related to Ca2+ uptake (VDAC) or overload (mitochondrial permeability transition pore).

