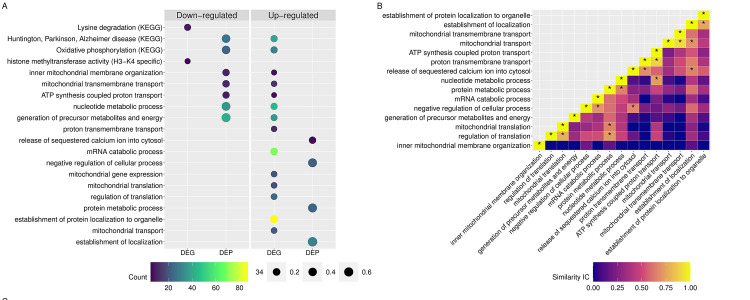
Fig 4.
(A) GO and KEGG pathways enriched for DEG and DEP. The size of the dots represents the ratio of DEG or DEP to the background used in the enrichment analysis. Since the background of DEG differs from that used for DEP, the points are color coded to note the number of DEG or DEP in each pathway. (B) Heatmap of the information content (IC) shared between two pathways. The asterisk (*) denotes two pathways that share an IC > 0.65.

