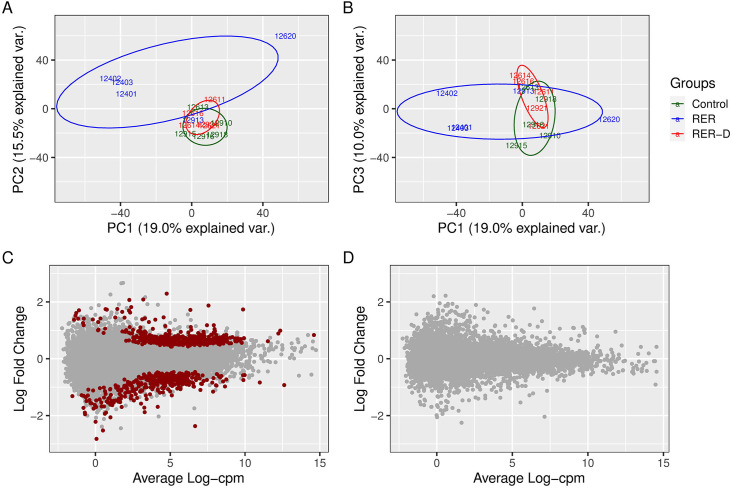
Fig 6. Principal component (PC) analysis of transcriptomic data for control, RER-susceptible (RER) and RER horses treated with dantrolene (RER-D).
(A) PC1 versus PC2. Note that RER-susceptible horses cluster separately from overlapping RER-D and controls. (B) PC1 and PC3. The proportion of variance explained by the RER and control groups is reduced by PC3. (C) MA plot depicting the average expression of gene transcripts compared to the log2 fold change of differentially expressed genes comparing RER-susceptible to controls. There were 812 differentially expressed genes (red dots) between RER-susceptible and control horses. (D) MA plot showing the average expression of gene transcripts compared to the log2 fold difference in differentially expressed genes in RER-D compared to controls. There were no significant differentially expressed genes observed between RER-D and controls.

