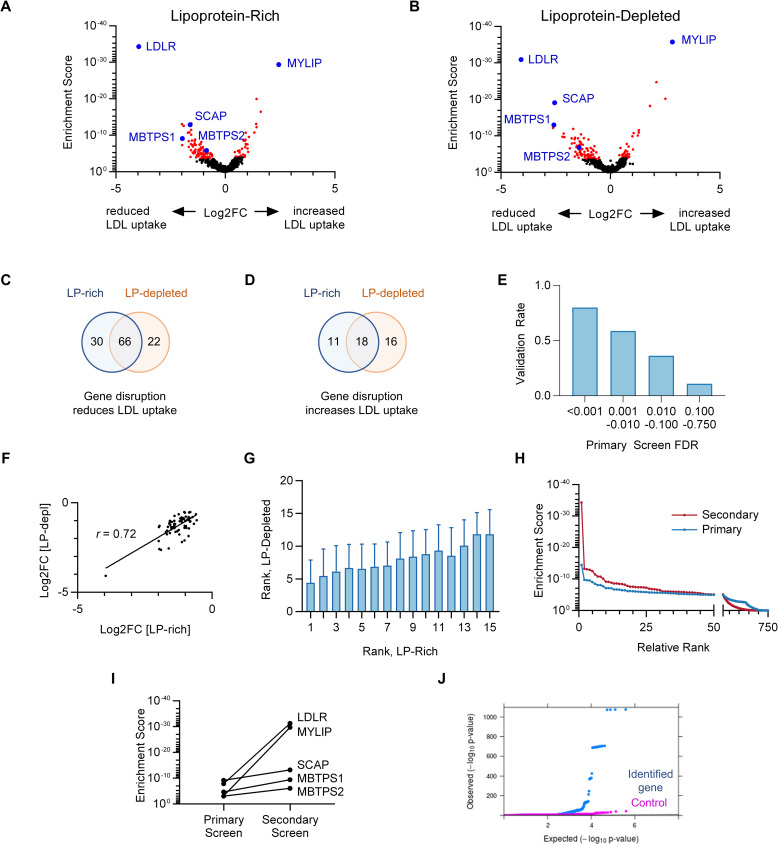
Fig 2. Targeted secondary CRISPR screens for modifiers of LDL uptake by HuH7 cells.
(A-B) Volcano plots displaying MAGeCK gene level enrichment scores and associated gRNA log2 fold changes for each gene tested in the secondary gRNA library, under lipoprotein-rich (A) or lipoprotein-depleted (B) cultured conditions, with genes identified with FDR<5% displayed in red and positive controls in blue. (C-D) Venn diagrams of genes identified whose targeting was associated with reduced (C) or enhanced (D) cellular LDL uptake under lipoprotein-rich and/or lipoprotein-depleted culture conditions. (E) Genes identified in the primary screen for LDL uptake were stratified by FDR tier and compared for their validation rate (FDR<5%) in the secondary screen for LDL uptake. (F) Correlation of effect size for genes identified as positive regulators of LDL uptake under both lipoprotein-rich and lipoprotein-depleted culture conditions. (G) Average relative ranking of each individual gRNA among the 15 gRNA per gene in lipoprotein-depleted conditions relative to ranking of that same gRNA in lipoprotein-rich conditions. (H) Cumulative distribution function of MAGeCK enrichment scores for genes tested in both the primary and secondary CRISPR screens for LDL uptake. (I) Comparison of MAGeCK gene level enrichment scores for positive control genes in the primary versus secondary CRISPR screens for LDL uptake. (J) QQ plot of LDL GWAS results in UK Biobank within identified LDL uptake regulator genes compared to matched control genes.

