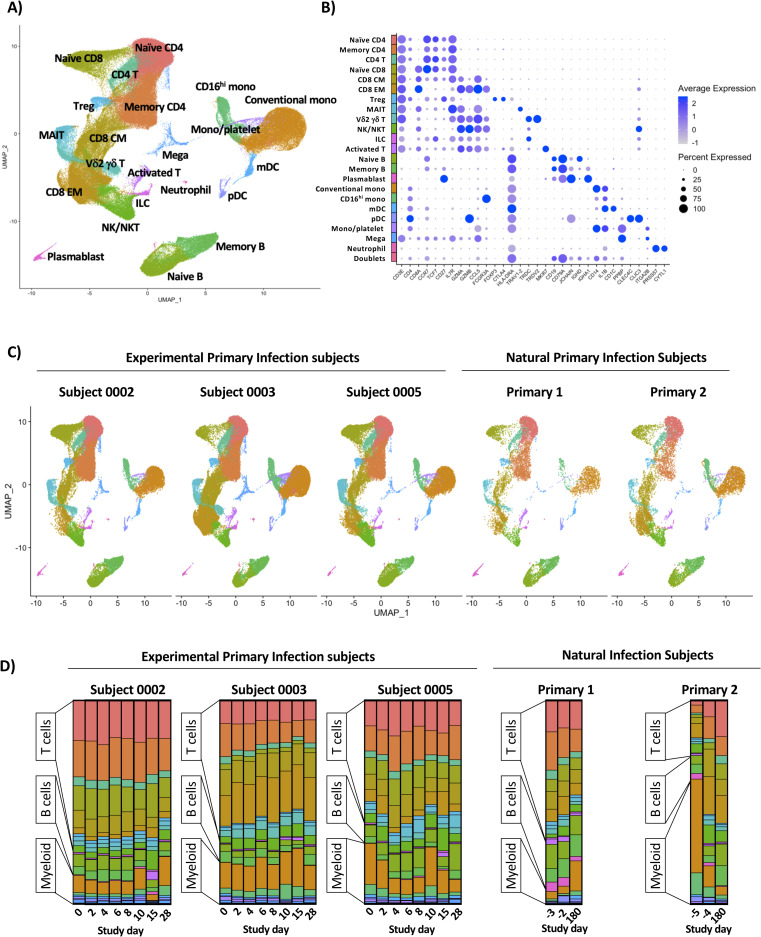
Fig 2. Annotation and quantification of major leukocyte populations following experimental or natural primary DENV-1 infection.
A) Integrated UMAP projection of scRNAseq data from all annotated leukocyte populations derived from all experimental primary DENV-1 infection subjects (n = 3, 8 time points per subject) and natural primary DENV-1 infection subjects (n = 2, 3 time points per subject). B) Expression of key linage defining gene products across all annotated leukocyte populations captured in this analysis. C) Integrated UMAP projection of all annotated leukocyte populations split by subject, including all time points. D) Relative population abundance in all subjects split by time point.

