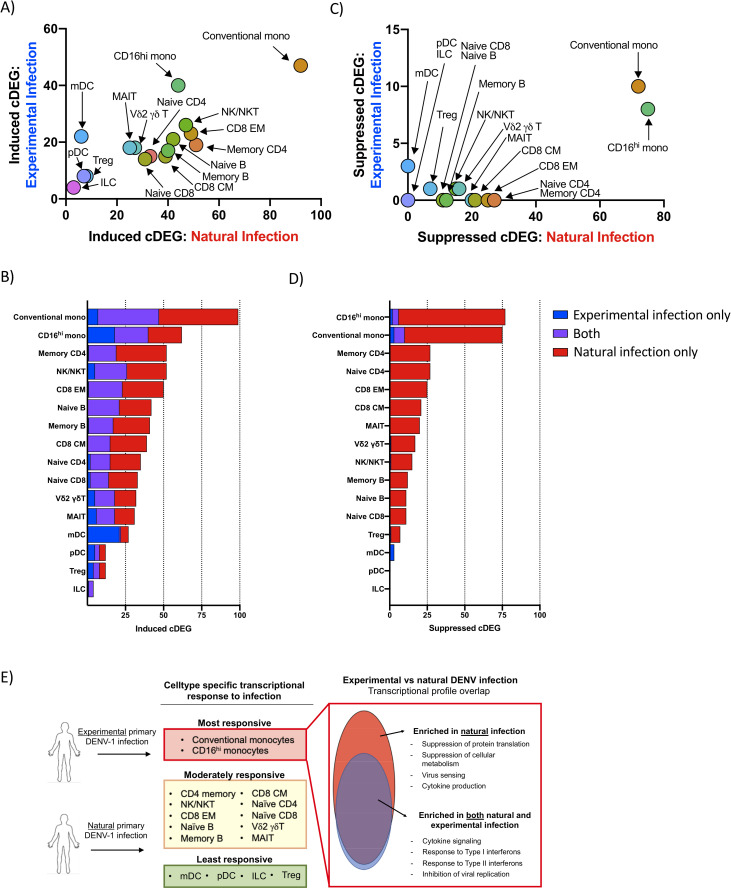
Fig 5.
Transcriptional profile overlap of experimental and natural primary DENV-1 infection A) Frequency and cell-population distribution of infection-induced cDEGs identified following experimental or natural primary DENV-1 infection. Experimental primary DENV-1 infection cDEGs restricted to study day 10. B) Frequency and overlap of infection-induced cDEGs identified following experimental or natural primary DENV-1 infection C) Frequency and cell-population distribution of infection-suppressed cDEGs identified following natural primary or experimental DENV-1 infection. Experimental primary DENV-1 infection cDEGs restricted to study day 10. D) Frequency and overlap of infection-suppressed cDEGs identified following natural or experimental primary DENV-1 infection. F) Schematic representation of the differential gene expression responses observed following either natural or experimental primary DENV infection.

