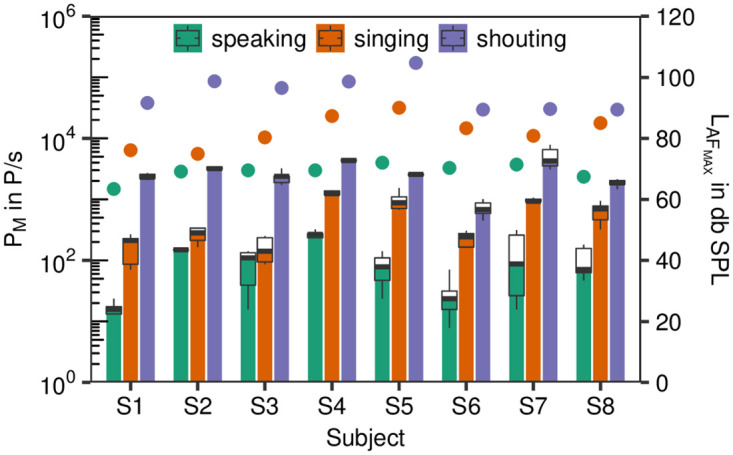
Fig 3. Emission rates.

Boxplots of the emission rates (PM in P/s, left y-axis) for the test conditions speaking, singing and shouting for subjects S1-S4 (girls) and S5-S8 (boys). The maximum sound pressure levels (LAFMAX in db SPL) are also shown (right y-axis) with different colored full circles for the test conditions.
