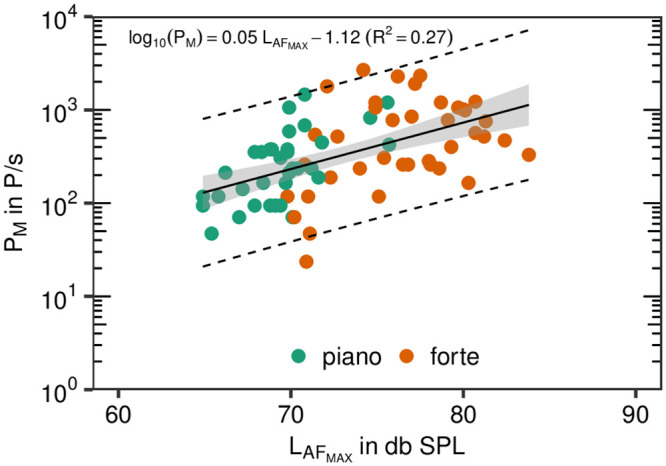
Fig 4. Emission rates vs. sound pressure level.

Emission rate PM plotted over maximum sound pressure level LAFMAX for sustained syllable /la/. All five repetitions for the two loudness conditions are represented by colored points as denoted in the legend. The black solid line represents the linear regression (see inset for details), the gray colored area represents the 95% confidence region, whereas the black dashed lines restrict the 95% prediction band.
