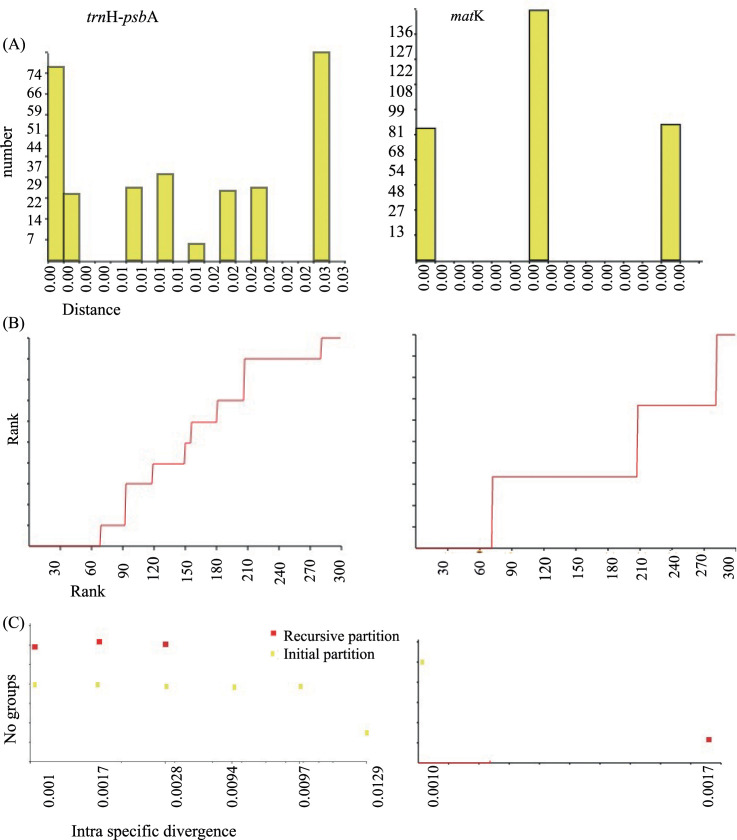
Fig 2. Schematic illustration of Automatic Barcode Gap Discovery (ABGD) with matK and trnH-psbA regions for Cinnamomum species.
(A) Distribution of pairwise differences. Low divergence represent intraspecific divergence, whereas higher divergence represents interspecific divergence (B) Ranked pairwise differences (C) Grouping.

