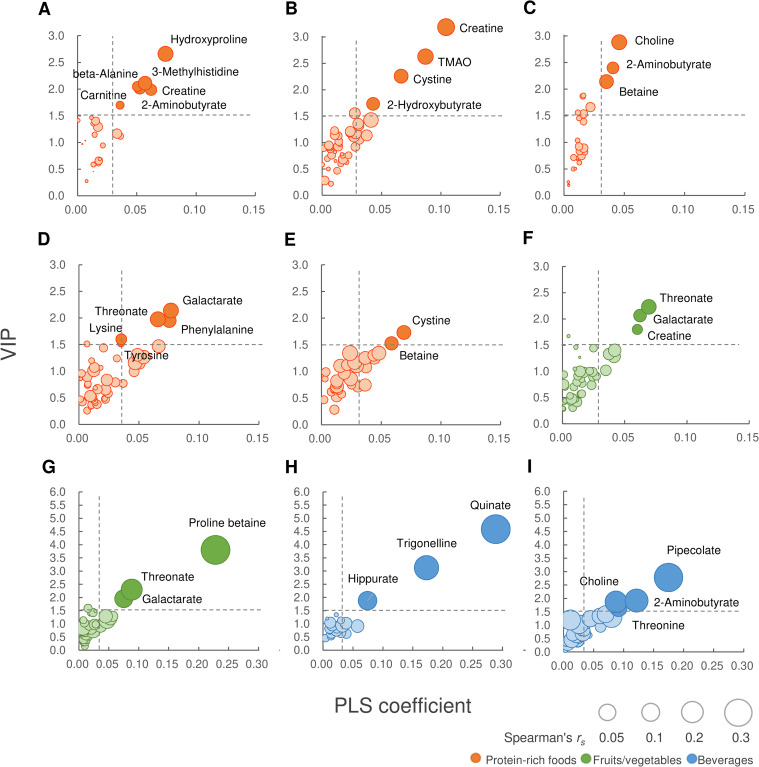
Fig 1. Overview of food biomarker candidates assessed by PLS-R (n = 7,012).
Relationships between the VIP score and the PLS coefficient are described using Spearman’s correlation coefficients. The vertical axis corresponds to the VIP score, the horizontal axis corresponds to the PLS coefficient, and the area of each circle corresponds to the correlation coefficient. Notable metabolites with VIP scores ≥ 1.5 and PLS coefficients ≥ 0.03 are highlighted. (A) meat, (B) fish/seafood, (C) eggs, (D) dairy, (E) soy products, (F) carotenoid-rich vegetables, (G) fruits, (H) coffee, and (I) alcohol. PLS-R, partial least square regression; VIP, variable importance in projection; TMAO, trimethylamine-N-oxide.

