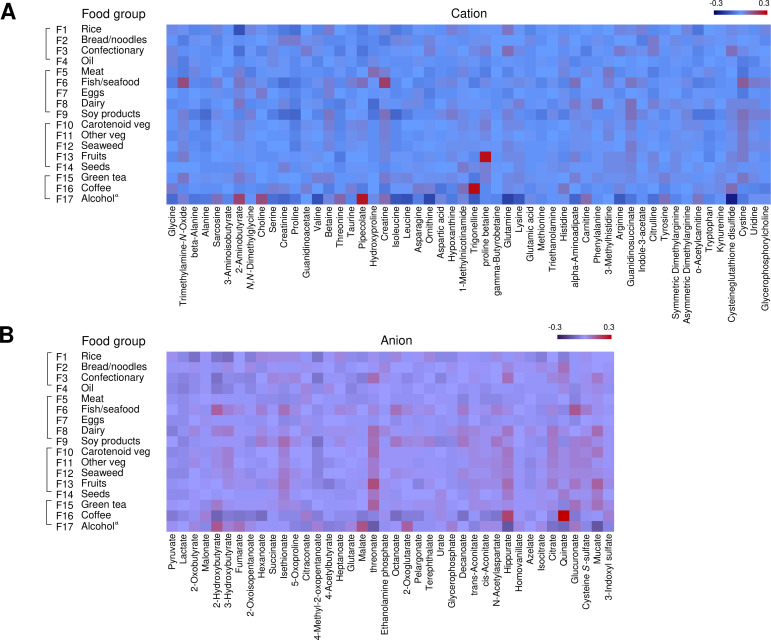
Fig 2. Correlation matrix diagram of the relationship between food groups and metabolites (n = 7,012).
This heatmap was generated with partial rank-order Spearman correlation coefficients, controlling for sex, smoking, and total physical activity levels. (A) cation, (B) anion. a Data of male drinkers (n = 2,449) were used in the analysis for alcohol.

