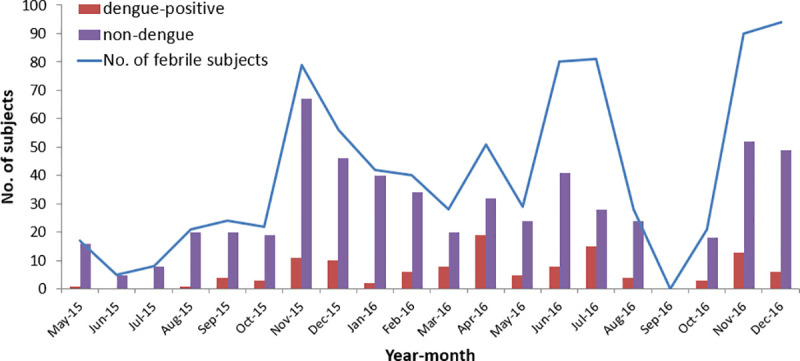
Fig 3. Monthly distribution of the enrolled febrile patients and dengue-positive patients.

The figure shows monthly distribution of dengue-positive and non-dengue cases among the enrolled patients.

The figure shows monthly distribution of dengue-positive and non-dengue cases among the enrolled patients.