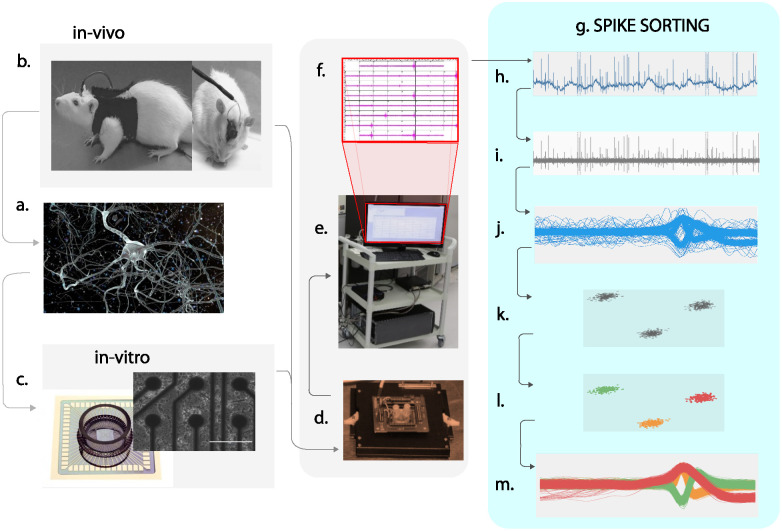
Fig 1. An overview of spike sorting process with in-vivo and in-vitro recordings.
(a) Microscopic image of neural network in the brain. (b) Brains cells cultured on the Micro-Electrode Arrays (MEAs). (c) Implanted probe in the rat brain for in vivo recordings. (d) Data acquisition system to interface with MEAs (e) Computing machine for data processing and spike sorting. (f) Multichannel data acquisition and recording (g) Visualisation of complete spike sorting process. (h) Raw data after sampling and amplification. (i) Noise filtering of data using band pass filters. (j) Spikes detected using the threshold or inter-spike interval methods. (k) Feature extraction of the detected spikes to reduce the dimensionality of the data. (l) Clustered features after applying clustering algorithms extracted spike features. (m) Clustered spikes.

