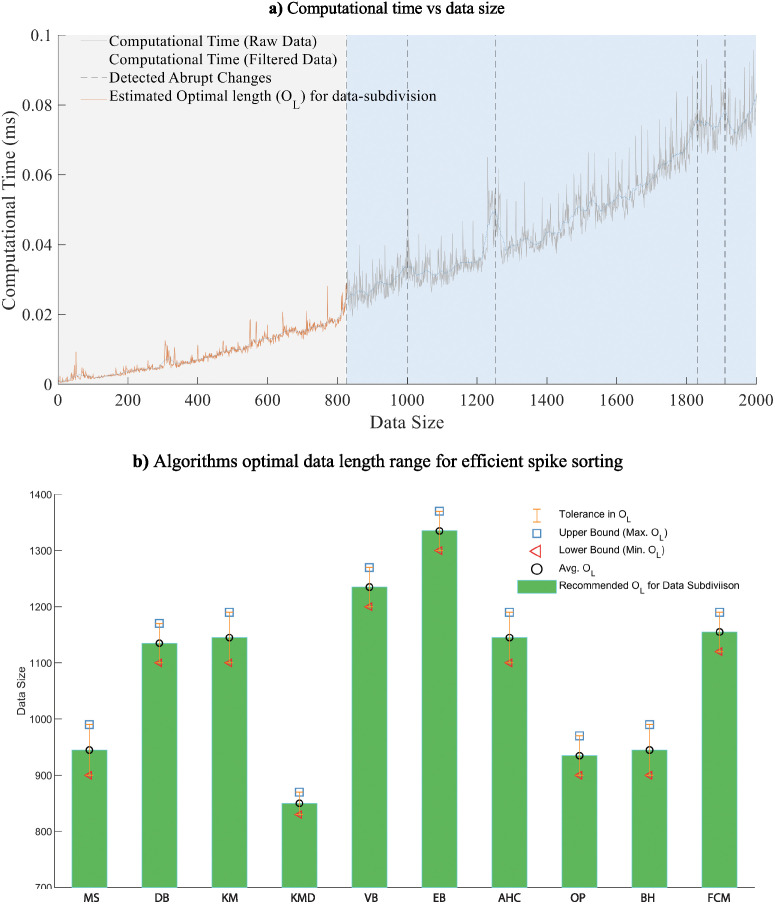
Fig 5. Identification of optimal length OL.
(a) Illustrates the description of steps involved in identifying the OL for spike sorting algorithms. Computational time versus data size plot. The X-axis shows the length of the data increasing from zero to 2000 while the Y-axis shows the corresponding time taken by the clustering algorithm to perform clustering process, in milliseconds. The computational time is the processing time after movmean filter(20 datapoints length) filtered the unwanted ripples in the plot and returned smooth curves. Detected abrupt changes in the plot taking 0.1 of the maximum rate of change in computational time as threshold (d) Identified optimal length OL of data subsets used for data subdivision. b) Optimal Length (OL) for ten commonly used clustering algorithms. The average value over ten repetitive analyses is given as robustness of the measure in optimal length for data subdivision.

