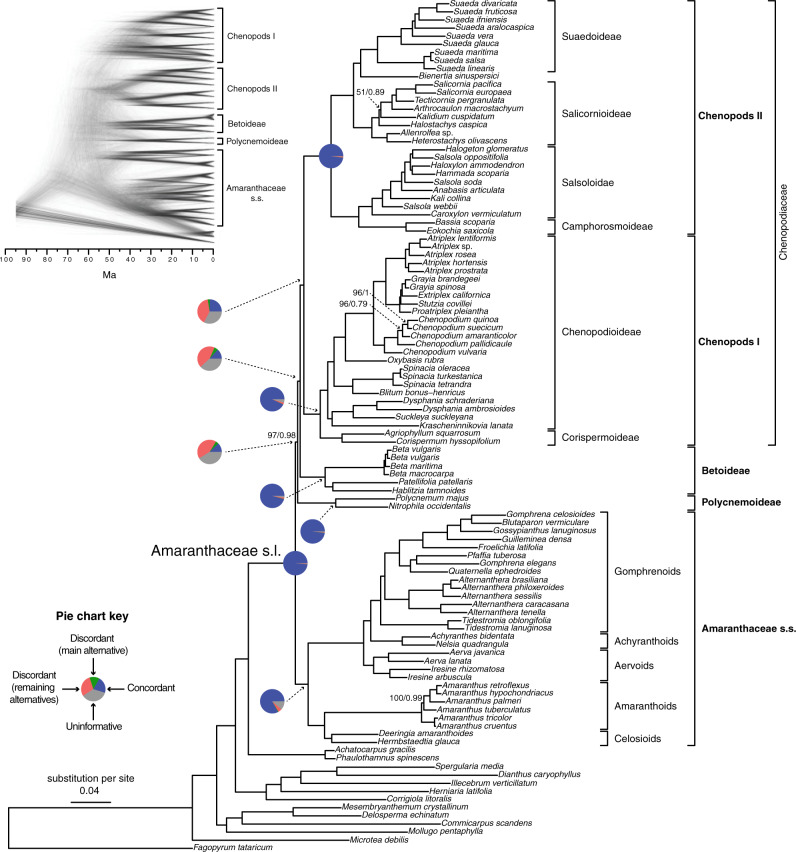
Figure 2.
Maximum likelihood phylogeny of Amaranthaceae s.l. inferred from RAxML analysis of the concatenated 936-nuclear gene supermatrix, which had the same topology as recovered from ASTRAL. All nodes have maximal support (bootstrap  /ASTRAL local posterior probability
  ) unless noted. Pie charts present the proportion of gene trees that support that clade (concordant), support the main alternative bifurcation, support the remaining alternatives, and the proportion (conflict or support) that have
  50% bootstrap support (uninformative). Only pie charts for major clades are shown (see Supplementary Fig.S2 available on Dryad for all node pie charts). Branch lengths are in number of substitutions per site. The inset (top left) shows the DensiTree cloudogram inferred from 1242 nuclear genes for the reduced 41-taxon data set.

