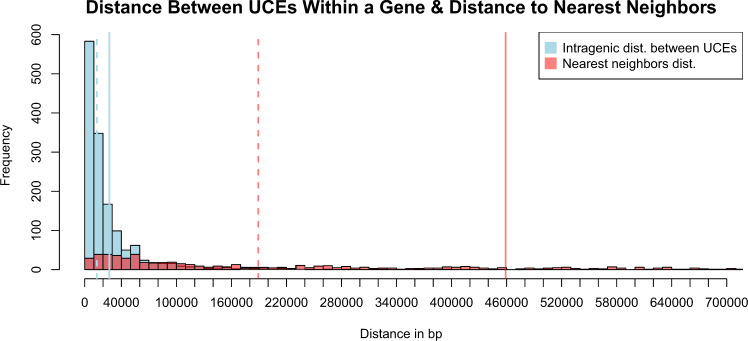
Figure 3.
Histogram of distances between UCEs in the 5k-Tetrapod UCE set. UCEs were mapped back to the chicken genome (blastn 100% matches of probe to base over 100% of the length of UCE probe). The distances between cogenic UCEs were then measured (light blue bars), followed by measuring the distance up and downstream from a genic set of UCEs to its nearest neighbor UCE (light red bars). Vertical solid lines indicate the mean distance between cogenic UCEs (blue) or mean distance to nearest neighboring UCE (red) for a cogenic set of UCEs, and dashed lines indicate the median. Both estimates are local to a UCE’s scaffold/chromosome.

