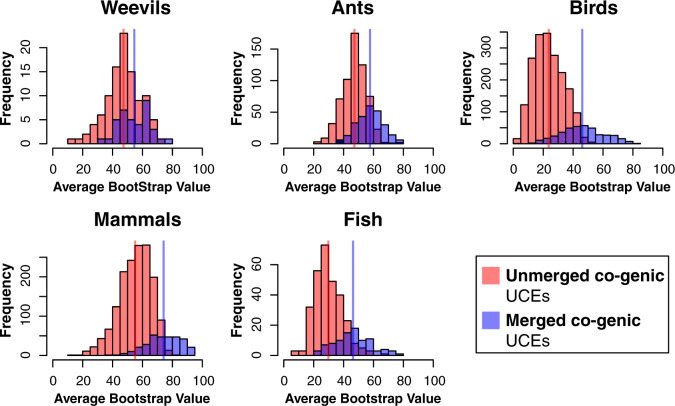
Figure 4.
Histograms of ABS values of gene trees for Merged cogenic UCEs and corresponding Unmerged cogenic UCEs (excluding all intergenic and singleton UCEs). Red bars represent ABS values of gene trees for Unmerged cogenic UCEs, where each individual UCE provides a single gene tree estimate. The purple bars represent the ABS of gene trees generated by Merged cogenic UCEs, where all UCEs representing a particular gene were merged to estimate a single gene tree. Vertical lines represent the mean ABS of each UCE set. The distributions are significantly different between Unmerged cogenic and Merged cogenic treatments, with the distribution of Merged cogenic UCE gene tree ABS higher than Unmerged cogenic.

