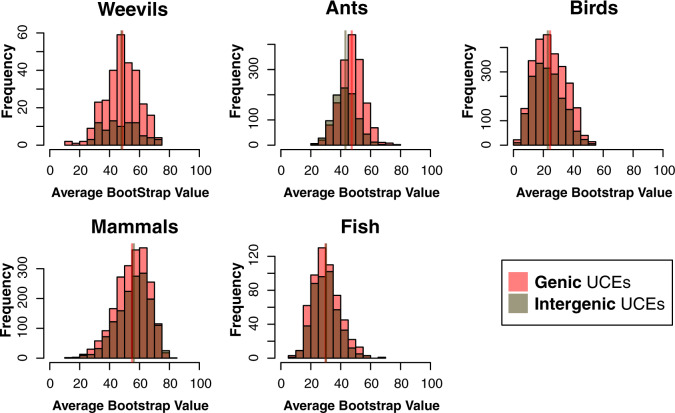
Figure 5.
Histograms of ABS values for gene trees based on Intergenic UCEs and Genic UCEs. Vertical lines represent the mean of the ABS values for each set of gene trees (overlapping or adjacent in all but ants). Generally, the distribution of ABS values for gene trees based on Intergenic UCEs and Genic UCEs are largely similar.

