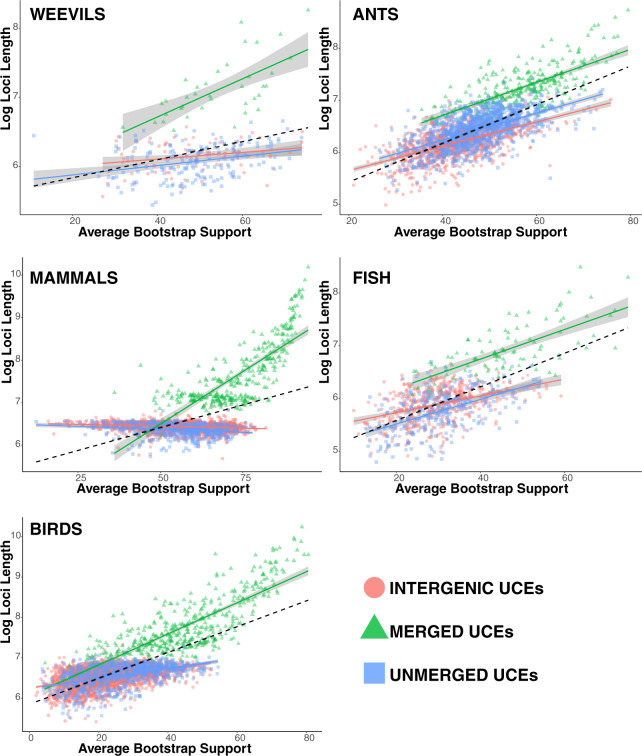
Figure 6.
Linear regression of log UCE length versus ABS values of the corresponding gene tree. Categories include Intergenic (all UCEs from intergenic regions), Merged (all merged cogenic UCEs), and Unmerged (all remaining genic UCEs that were single representatives of single genes). The dashed line represents the correlation of ABS values versus log loci length for all gene trees. Gray regions around regression lines represent the 95% confidence interval. Generally, ABS values increase with increasing loci length.

