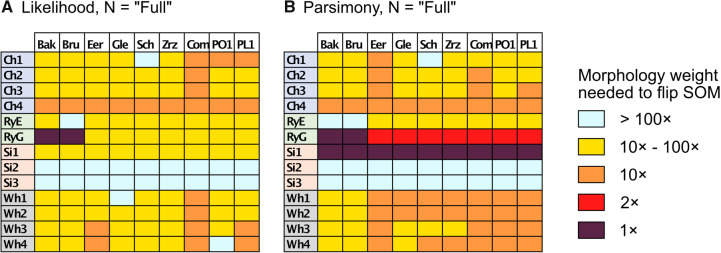
Figure 3.
Molecular topology stability heat maps comparing the weights at which the flip from Ctenophora to another SOM occurs for the “full” taxa data sets for the C10 model with Mk for morphology (a, left, likelihood) and the LGX2 transformation matrix with no transformation for morphology (b, right, parsimony). The stability of the molecular topology is greater when the flip requires a higher weighting of morphological characters.

