
Figure 1.
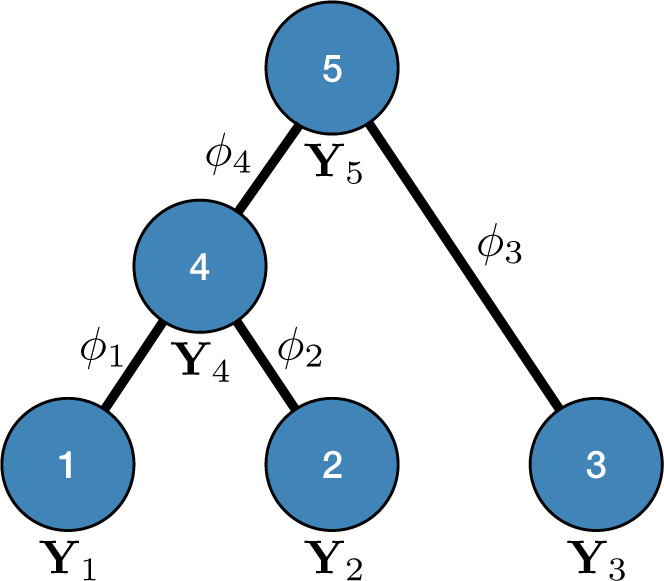
Example tree with  tips. Assume trait data
  are fully observed for
  . We write
  and
and  to denote the observed data below and above node
  respectively. Specifically,
  while
while  . Partial likelihoods
  and
and  .
.
Official websites use .gov
A
.gov website belongs to an official
government organization in the United States.
Secure .gov websites use HTTPS
A lock (
) or https:// means you've safely
connected to the .gov website. Share sensitive
information only on official, secure websites.
Example tree with tips. Assume trait data are fully observed for . We write and to denote the observed data below and above node respectively. Specifically, while . Partial likelihoods and .