
Figure 4.
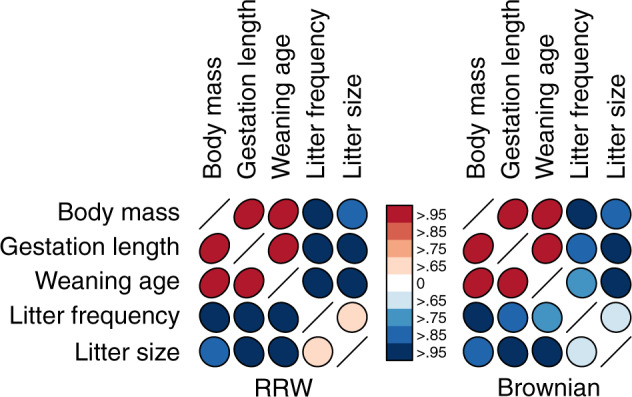
Posterior mean correlation between mammalian life history traits under the RRW and strict Brownian diffusion model. Shape of ellipse indicates strength and sign of correlation, while colors indicate the posterior probability that the correlation is positive (red) or negative (blue).