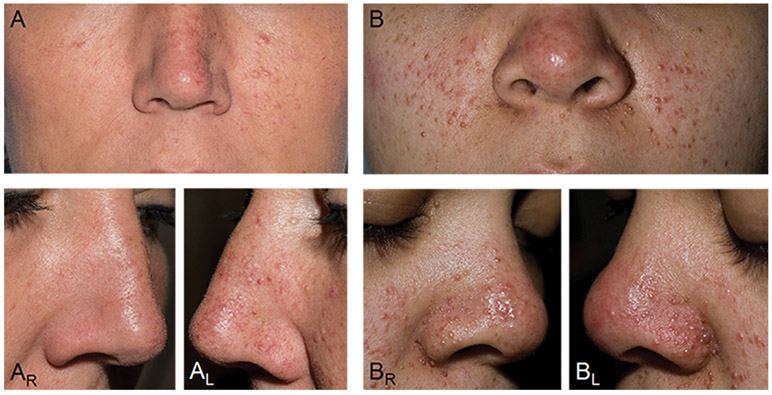
Figure 1. The Clinical Picture of Mosaicism in Tuberous Sclerosis Complex.
(A) Mosaicism with an asymmetric distribution of angiofibromas (AFs) on the nose and cheeks. (AR, AL) Right and left lateral views of the nose highlight the left sided predominance of AFs. (B) Mosaicism with numerous AFs distributed symmetrically on the nose and cheeks, indistinguishable from a patient with germline TSC. (BR, BL) Right and left lateral views of the nose reveal more numerous and symmetric distribution of AFs.

