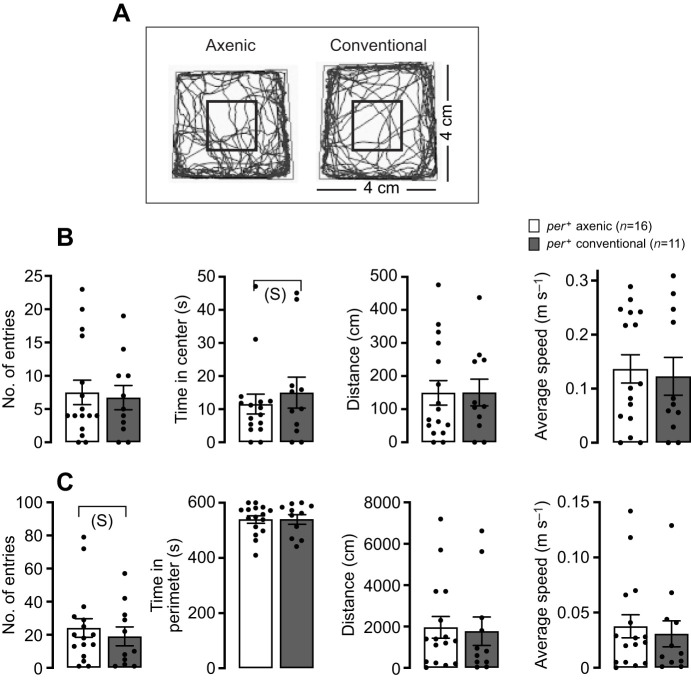
Fig. 2.
Effect of the microbiome on anxiety-like behavior. (A) Traces of single axenic (left) and conventional (right) wild-type flies recorded for 10 min in an arena. (B,C) Quantification of entries into the center (B; indicated by a black square in the center of the arena shown in A) and the periphery (C; corresponding to the rest of the arena shown in A) of the arena for axenic (white bars) and conventional (gray bars) wild-type flies (flies from the isogenic per+ strain were used). Results are shown as means± s.e.m.; n corresponds to the number of flies tested. P>0.05 for all comparisons; S: small effect; Hedges' g effect size analysis; no letter means no effect. See Table S1 for values.

