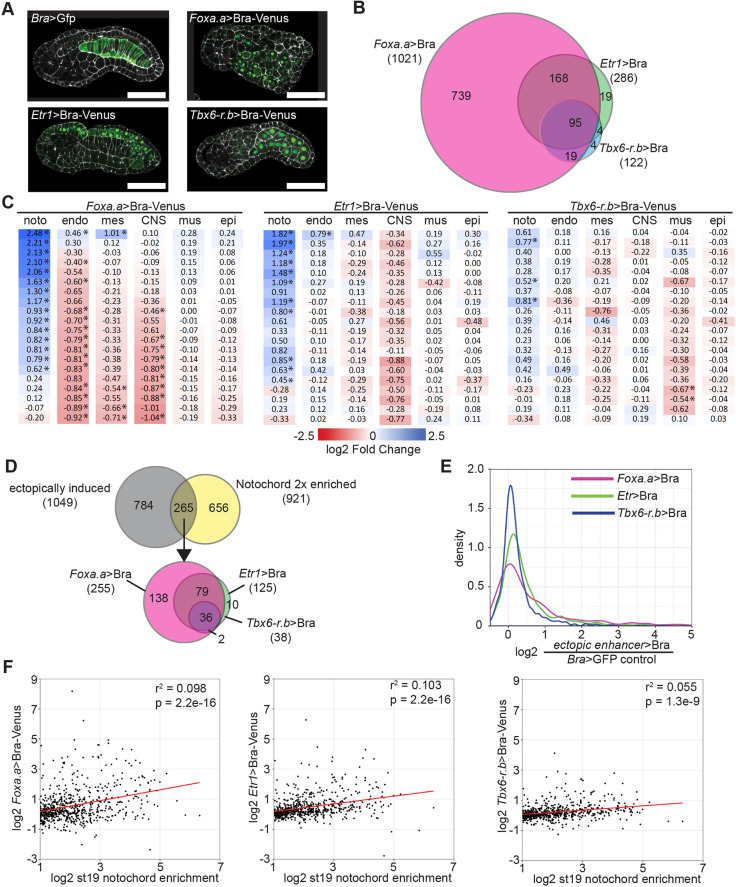
Fig. 1.
Ectopic expression of Bra upregulates a subset of notochord-enriched genes. (A) Venus-tagged Bra was misexpressed in Ciona embryos using the Foxa.a, Etr1 or Tbx6-r.b enhancers. Bra>GFP plasmid was used for control embryos. Phalloidin is in white; Venus is in green. Scale bars: 50 μm. (B) Differential expression was calculated using DESeq2. The overlap of all genes with significantly increased expression is shown. (C) Effects of Bra misexpression on the expression of tissue-specific markers. Marker genes highly enriched in notochord (noto), endoderm (endo), mesenchyme (mes), central nervous system (CNS), muscle (mus) and epidermis (epi) were identified using the scRNAseq data of Cao et al. (2019). Log fold changes of Bra misexpression compared with control are shown. *Padj≤0.05. (D) Overlap of genes with at least twofold enriched notochord expression (Reeves et al., 2017) and genes upregulated by Bra misexpression. (E) Kernel density plot of the increase in expression by ectopic Bra for twofold notochord-enriched genes. (F) Scatter plots of notochord enrichment at stage 19 in wild-type embryos (Reeves et al., 2017) versus the fold change in response to Bra misexpression driven by the different constructs. Only genes with a statistically significant stage 19 notochord enrichment of at least twofold are shown. The red lines show the best fit linear regressions.

