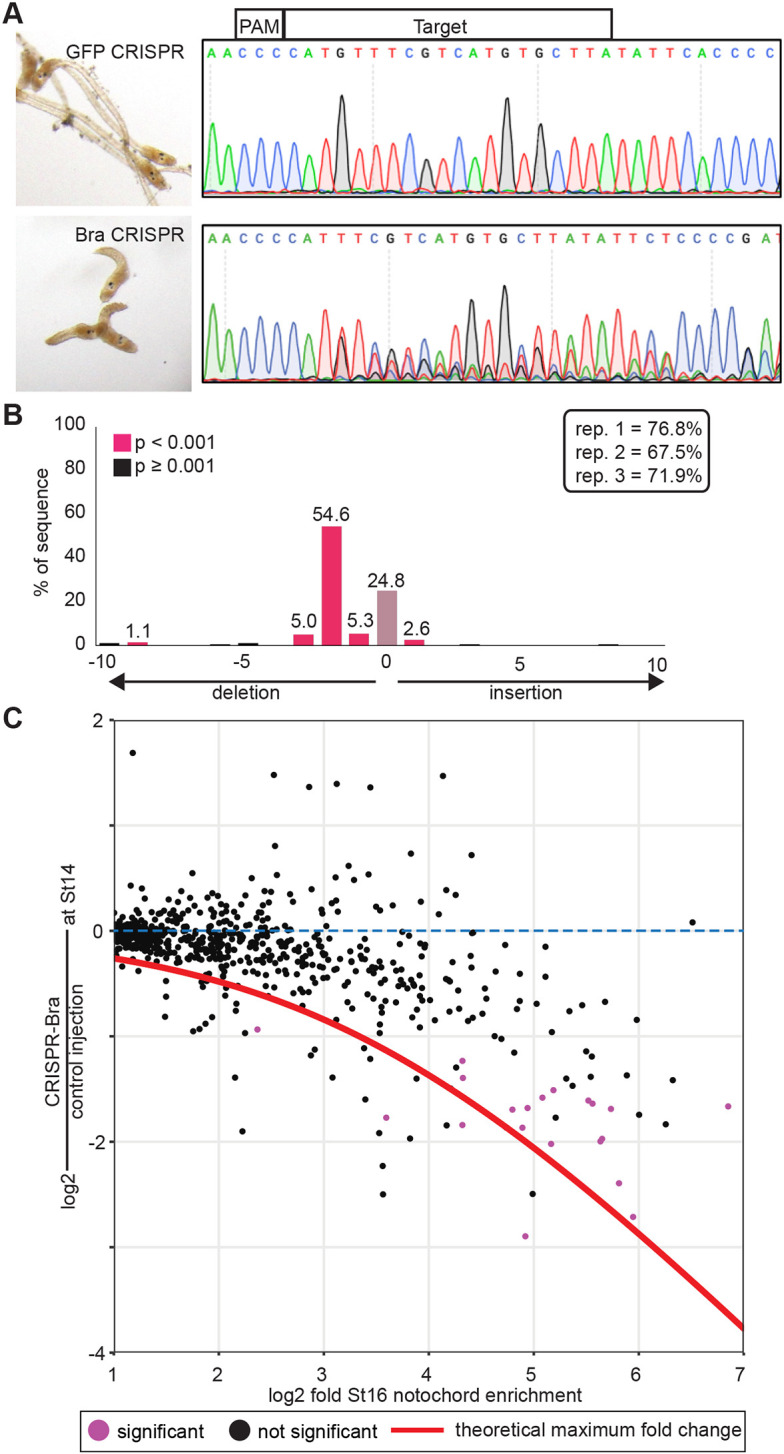
Fig. 2.

Somatic CRISPR disruption of Bra. (A) Eggs were injected with RNP-guide RNA complexes targeting either GFP (control, top) or Bra (bottom). Representative embryos at late tailbud are shown on the left with sequencing results used for TIDE analysis of the Bra locus on the right. (B) TIDE results from one replicate, showing efficient mutagenesis giving rise largely to a 2 bp deletion in injected embryos. TIDE-estimated indel rates for the three RNAseq replicates are shown in the inset. (C) Notochord enrichment at stage 16 (Reeves et al., 2017) compared with change in expression at stage 14 in CRISPR-Bra-injected embryos versus controls. Only genes with a statistically significant stage 16 notochord enrichment of at least twofold are shown. Red line indicates the theoretical maximum decrease observable in whole-embryo RNAseq for a given notochord enrichment value. Genes with a statistically significant decrease in expression in CRISPR-Bra embryos (Padj≤0.05) are purple.
