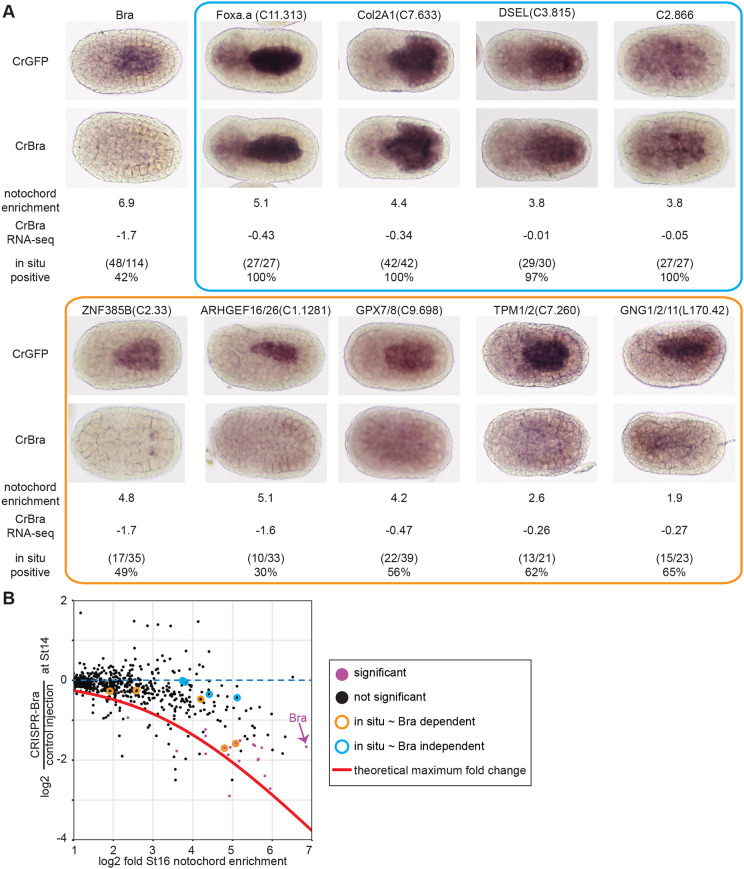
Fig. 3.
Expression patterns of notochord-enriched genes in Bra crispant embryos. (A) Injected embryos were fixed at stage 16 and stained by in situ hybridization using probes for the indicated genes. As mosaic expression was not observed in control embryos, Bra crispant embryos were scored as positive if they had uniform expression in the notochord and as negative if there was either a total loss of notochord expression or a mosaic loss in a subset of notochord cells. Representative embryos are shown along with log2 notochord enrichment at stage 16 (Reeves et al., 2017) and log2 fold change in Bra crispant embryos. The blue and orange boxes indicate nominally Bra-independent genes and Bra-dependent genes, respectively. (B) Scatter plot of notochord enrichment and Bra CRISPR fold change comparable with Fig. 2C, but now highlighting the specific genes tested by in situ hybridization. Genes with a statistically significant decrease in expression in CRISPR-Bra embryos (Padj≤0.05) by RNAseq are purple.

