Fig. 4.
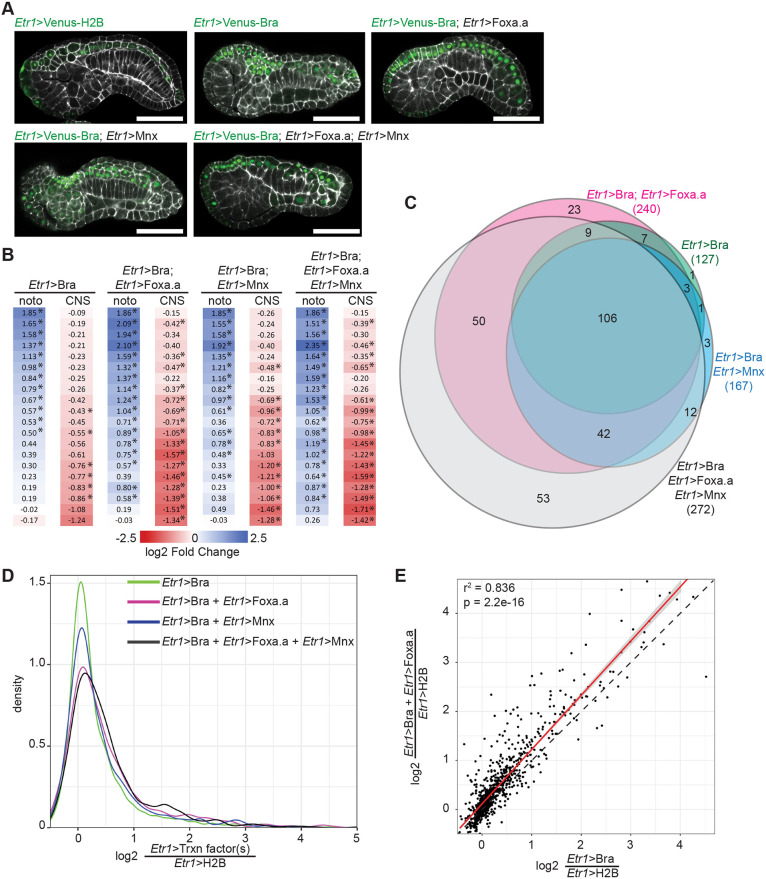
Combinatorial misexpression of Bra, Foxa.a and Mnx. (A) Representative confocal images of embryos expressing different combinations of Bra-Venus, Foxa.a-myc and/or Mnx-HA fusion proteins under the control of the pan-neural Etr1 enhancer. Etr1>H2B-Venus was expressed in control embryos. Embryos were collected for RNAseq and confocal imaging at stage 19. Phalloidin is shown in white; Venus is in green. Scale bars: 50 μm. (B) Effect of transcription factor misexpression on tissue-specific markers derived from Cao et al. (2019) as in Fig. 1. noto, notochord; CNS, central nervous system. *Padj≤0.05. (C) Overlap of notochord twofold enriched genes whose expression is significantly upregulated by misexpression of the indicated transcription factors. (D) Kernel density plot of the fold-change of expression for twofold enriched notochord genes in response to different ectopic transcription factor combinations. (E) Comparison of differential expression due to Bra misexpression alone versus the Bra/Foxa.a combination. Best fit linear regression shown in red flanked by the 95% confidence interval. The dotted line indicates a perfect 1:1 relationship.

