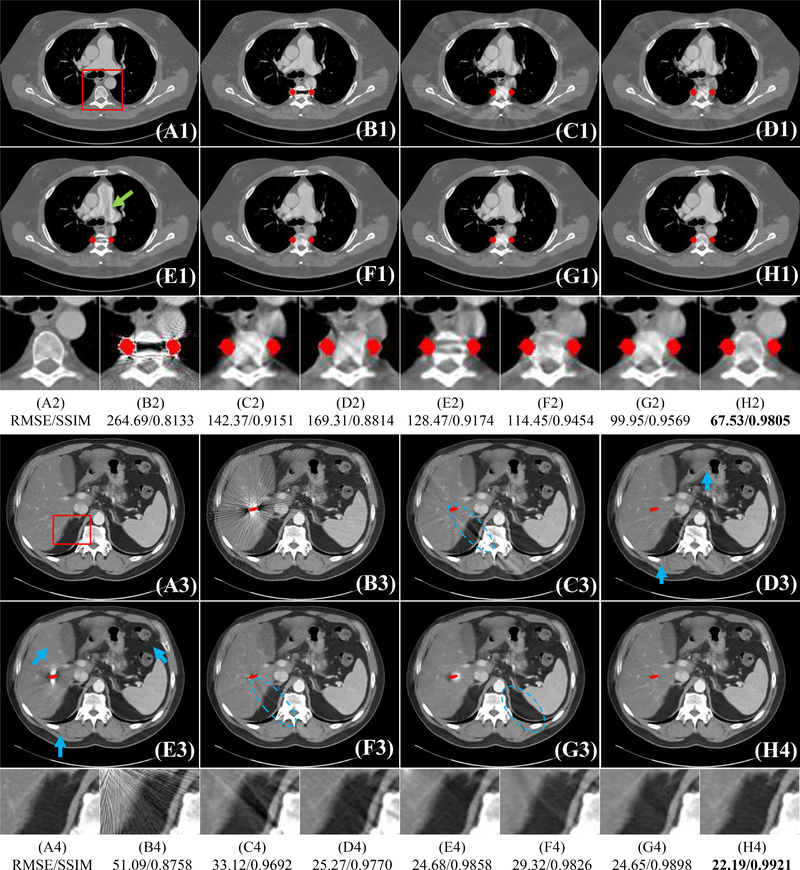
Fig. 3:
Visual comparison with different methods on DeepLesion dataset. The simulated metal masks are colored in red for better visualization. The (A1-A4) are refer images. We show the MAR results of LI [2] (C1-C4), NMAR [15] (D1-D4), CNNMAR [11] (E1-E4), cGANMAR [38] (F1-F4), DuDoNet [35] (G1-G4), and our method (H1-H4). The display window of the first and second samples are [−480 560] and [−175, 275] HU, respectively. We also use ROI RMSE and ROI SSIM to show quantitative results for a better comparison.

