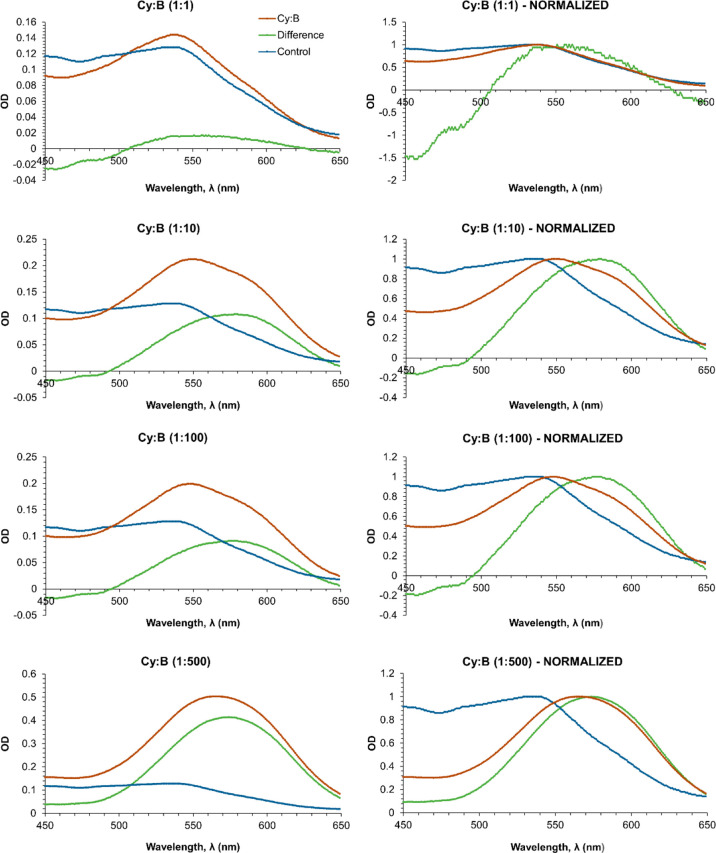
Figure 5.
UV–vis spectra of cyanidin-based anthocyanins solutions containing B at the various Cy:B ratios explored (red curves), at pH 5. The curves (green) resulting from subtracting the control solution (blue curves) spectrum (left) are also shown. Normalized curves (right) are also shown to more clearly note bathochromic shifts.

