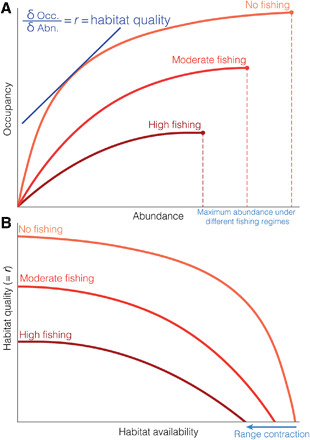
Fig. 1. Linking dynamic geography to abundance-occupancy.

(A) Changes in abundance-occupancy with varying levels of fishing shown in different shades of red. Slope tangent to the line represents r, the population growth rate, which is synonymous with, and indeed a definition of, habitat quality. Increasing fishing pressure causes the occupancy curve to approach its asymptotic limit for a smaller given abundance compared to no fishing pressure. The maximum abundance of a given population shrinks under stronger fishing regimes, as shown with the point and the dashed line. (B) Curves derived from (A) showing changes in habitat quality (= r) with habitat availability with varying levels of fishing. When fishing pressure is high, the abundance-occupancy curve approaches its asymptotic limit (r = 0) at a lower given occupancy (A), resulting in a steeper decline in population growth rate and habitat quality for a given available habitat, resulting in a geographic range contraction.
